Notes
A repository dedicated to spotlighting concepts and techniques in cartographic abstraction and practice. As such, very much a work in progress, and ever expanding.

A repository dedicated to spotlighting concepts and techniques in cartographic abstraction and practice. As such, very much a work in progress, and ever expanding.
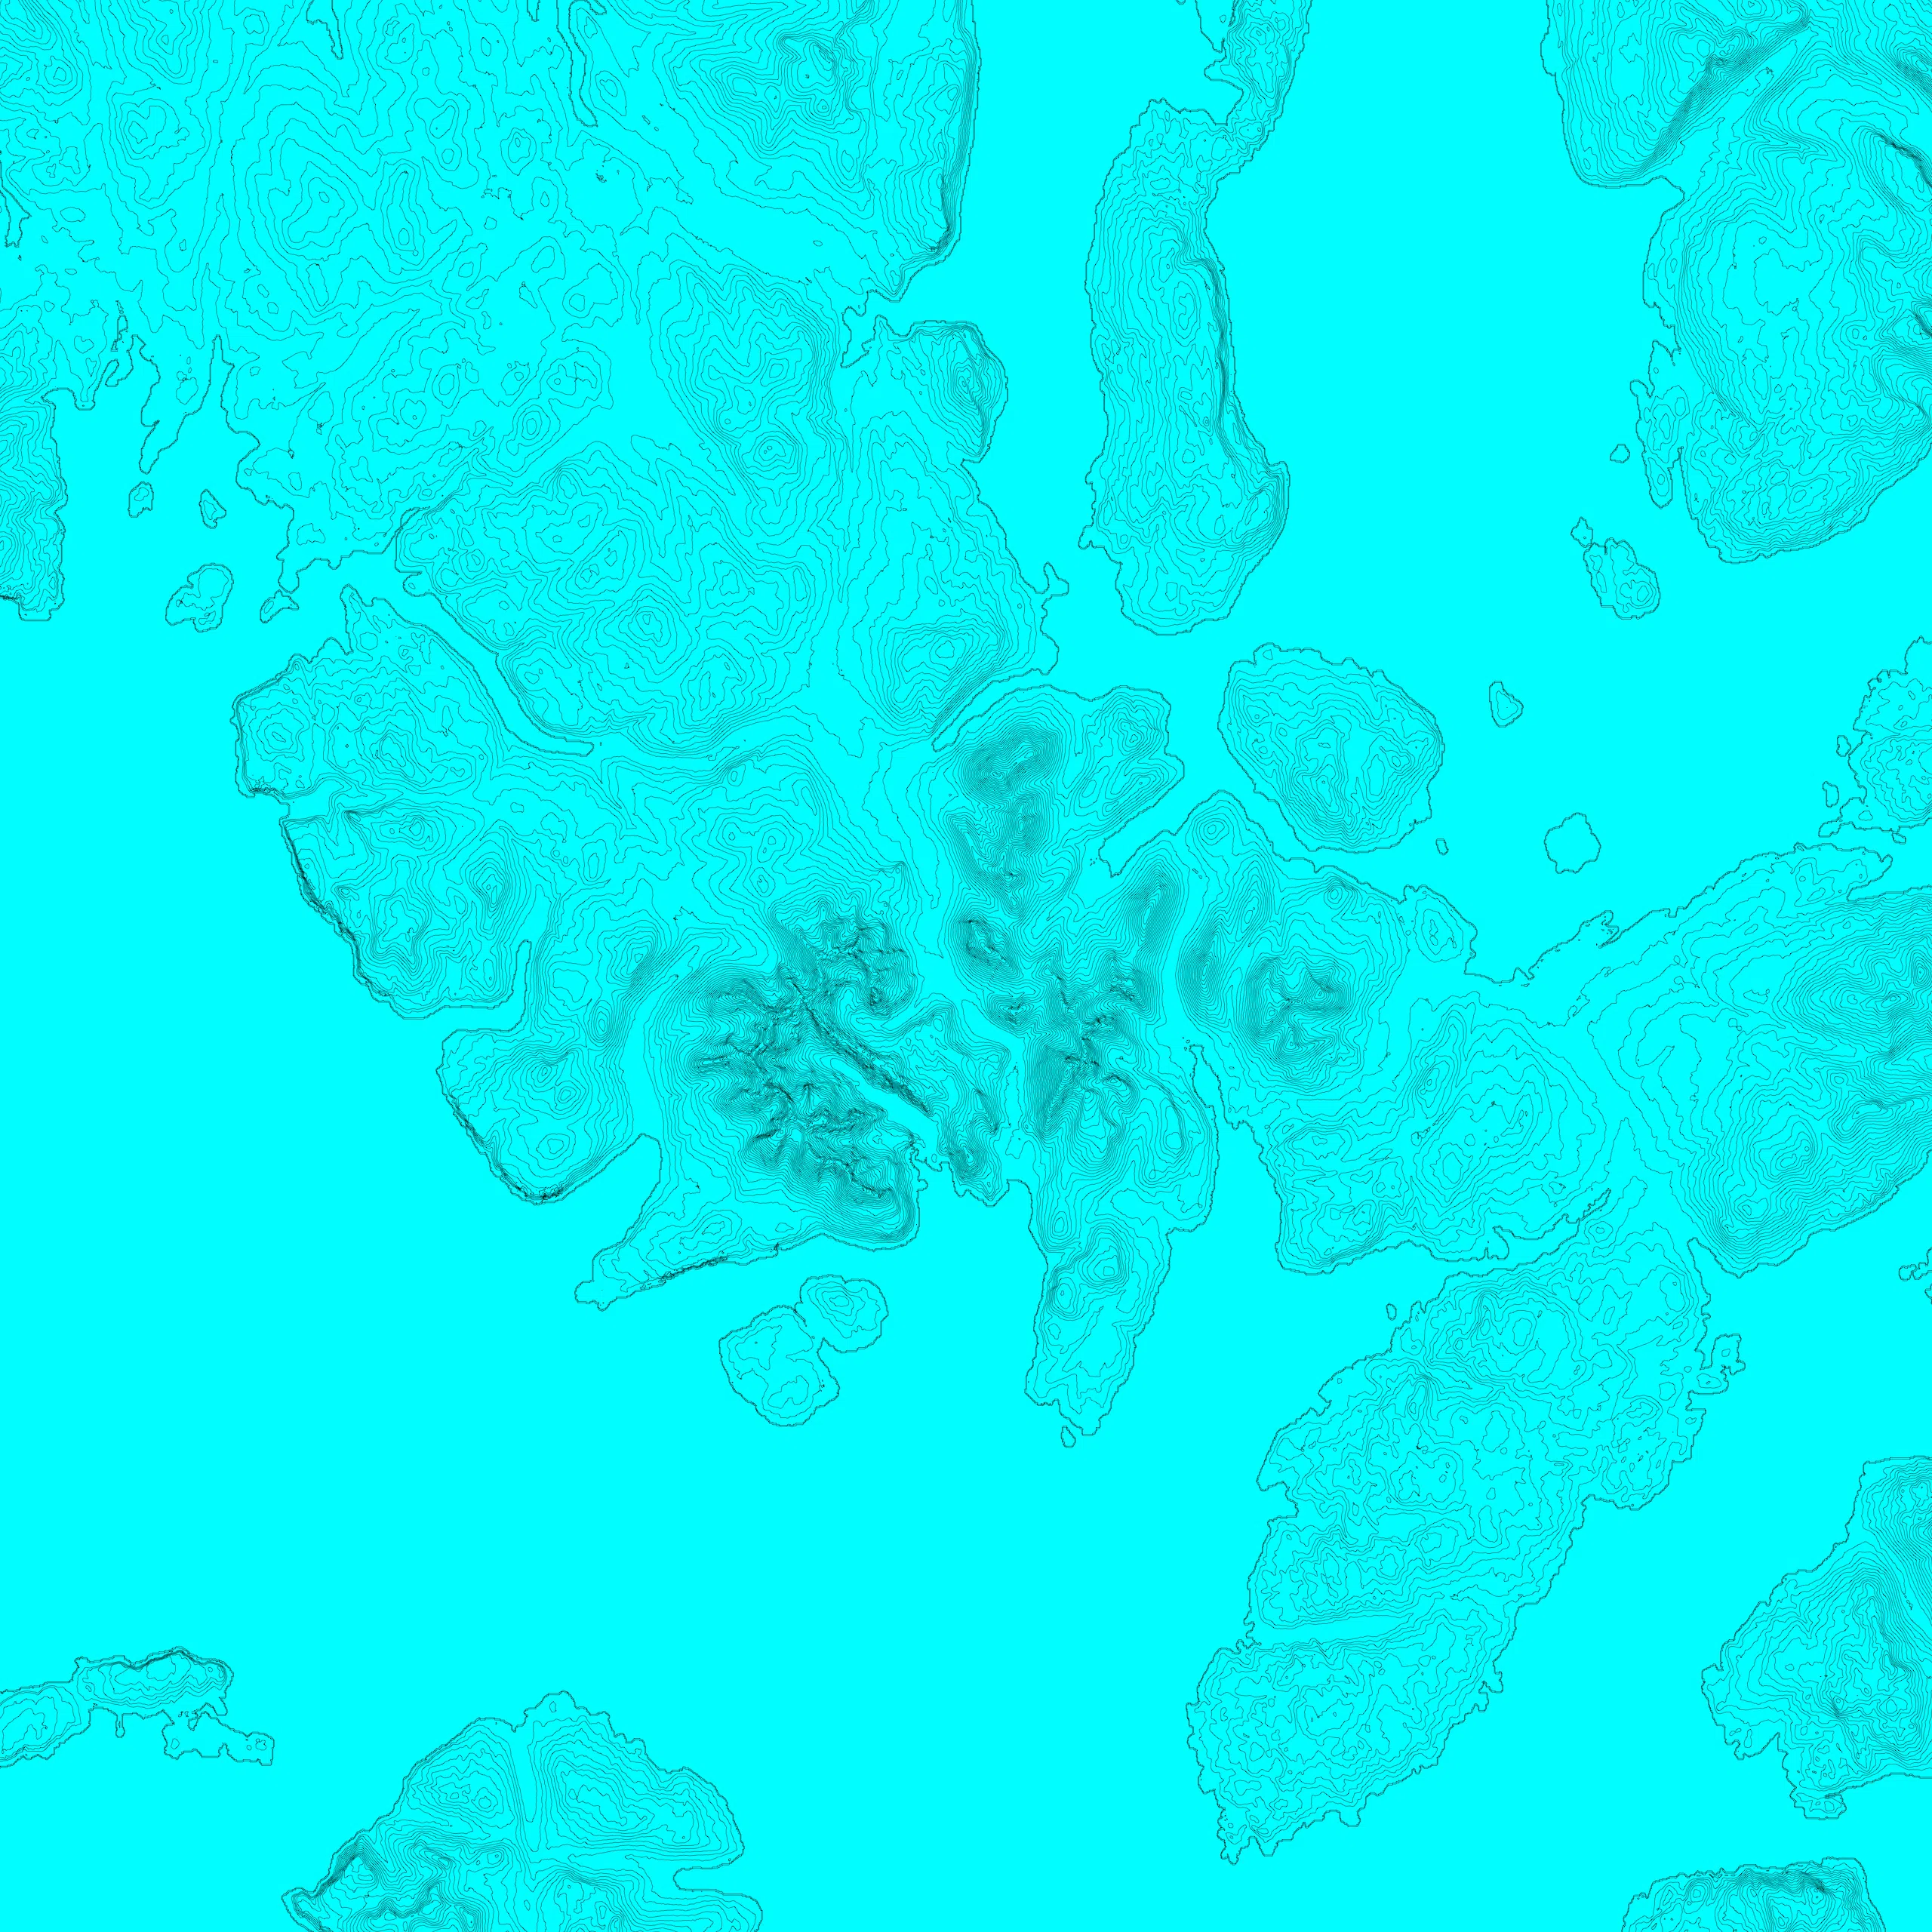
The Cuillins and Blà Bheinn on the Isle of Skye, Scotland. Contours are an isarithmic line, a form of isoline or isopleth; joining points of equivalent value. As a pure form of abstraction, the contour is very revealing of landscape form.
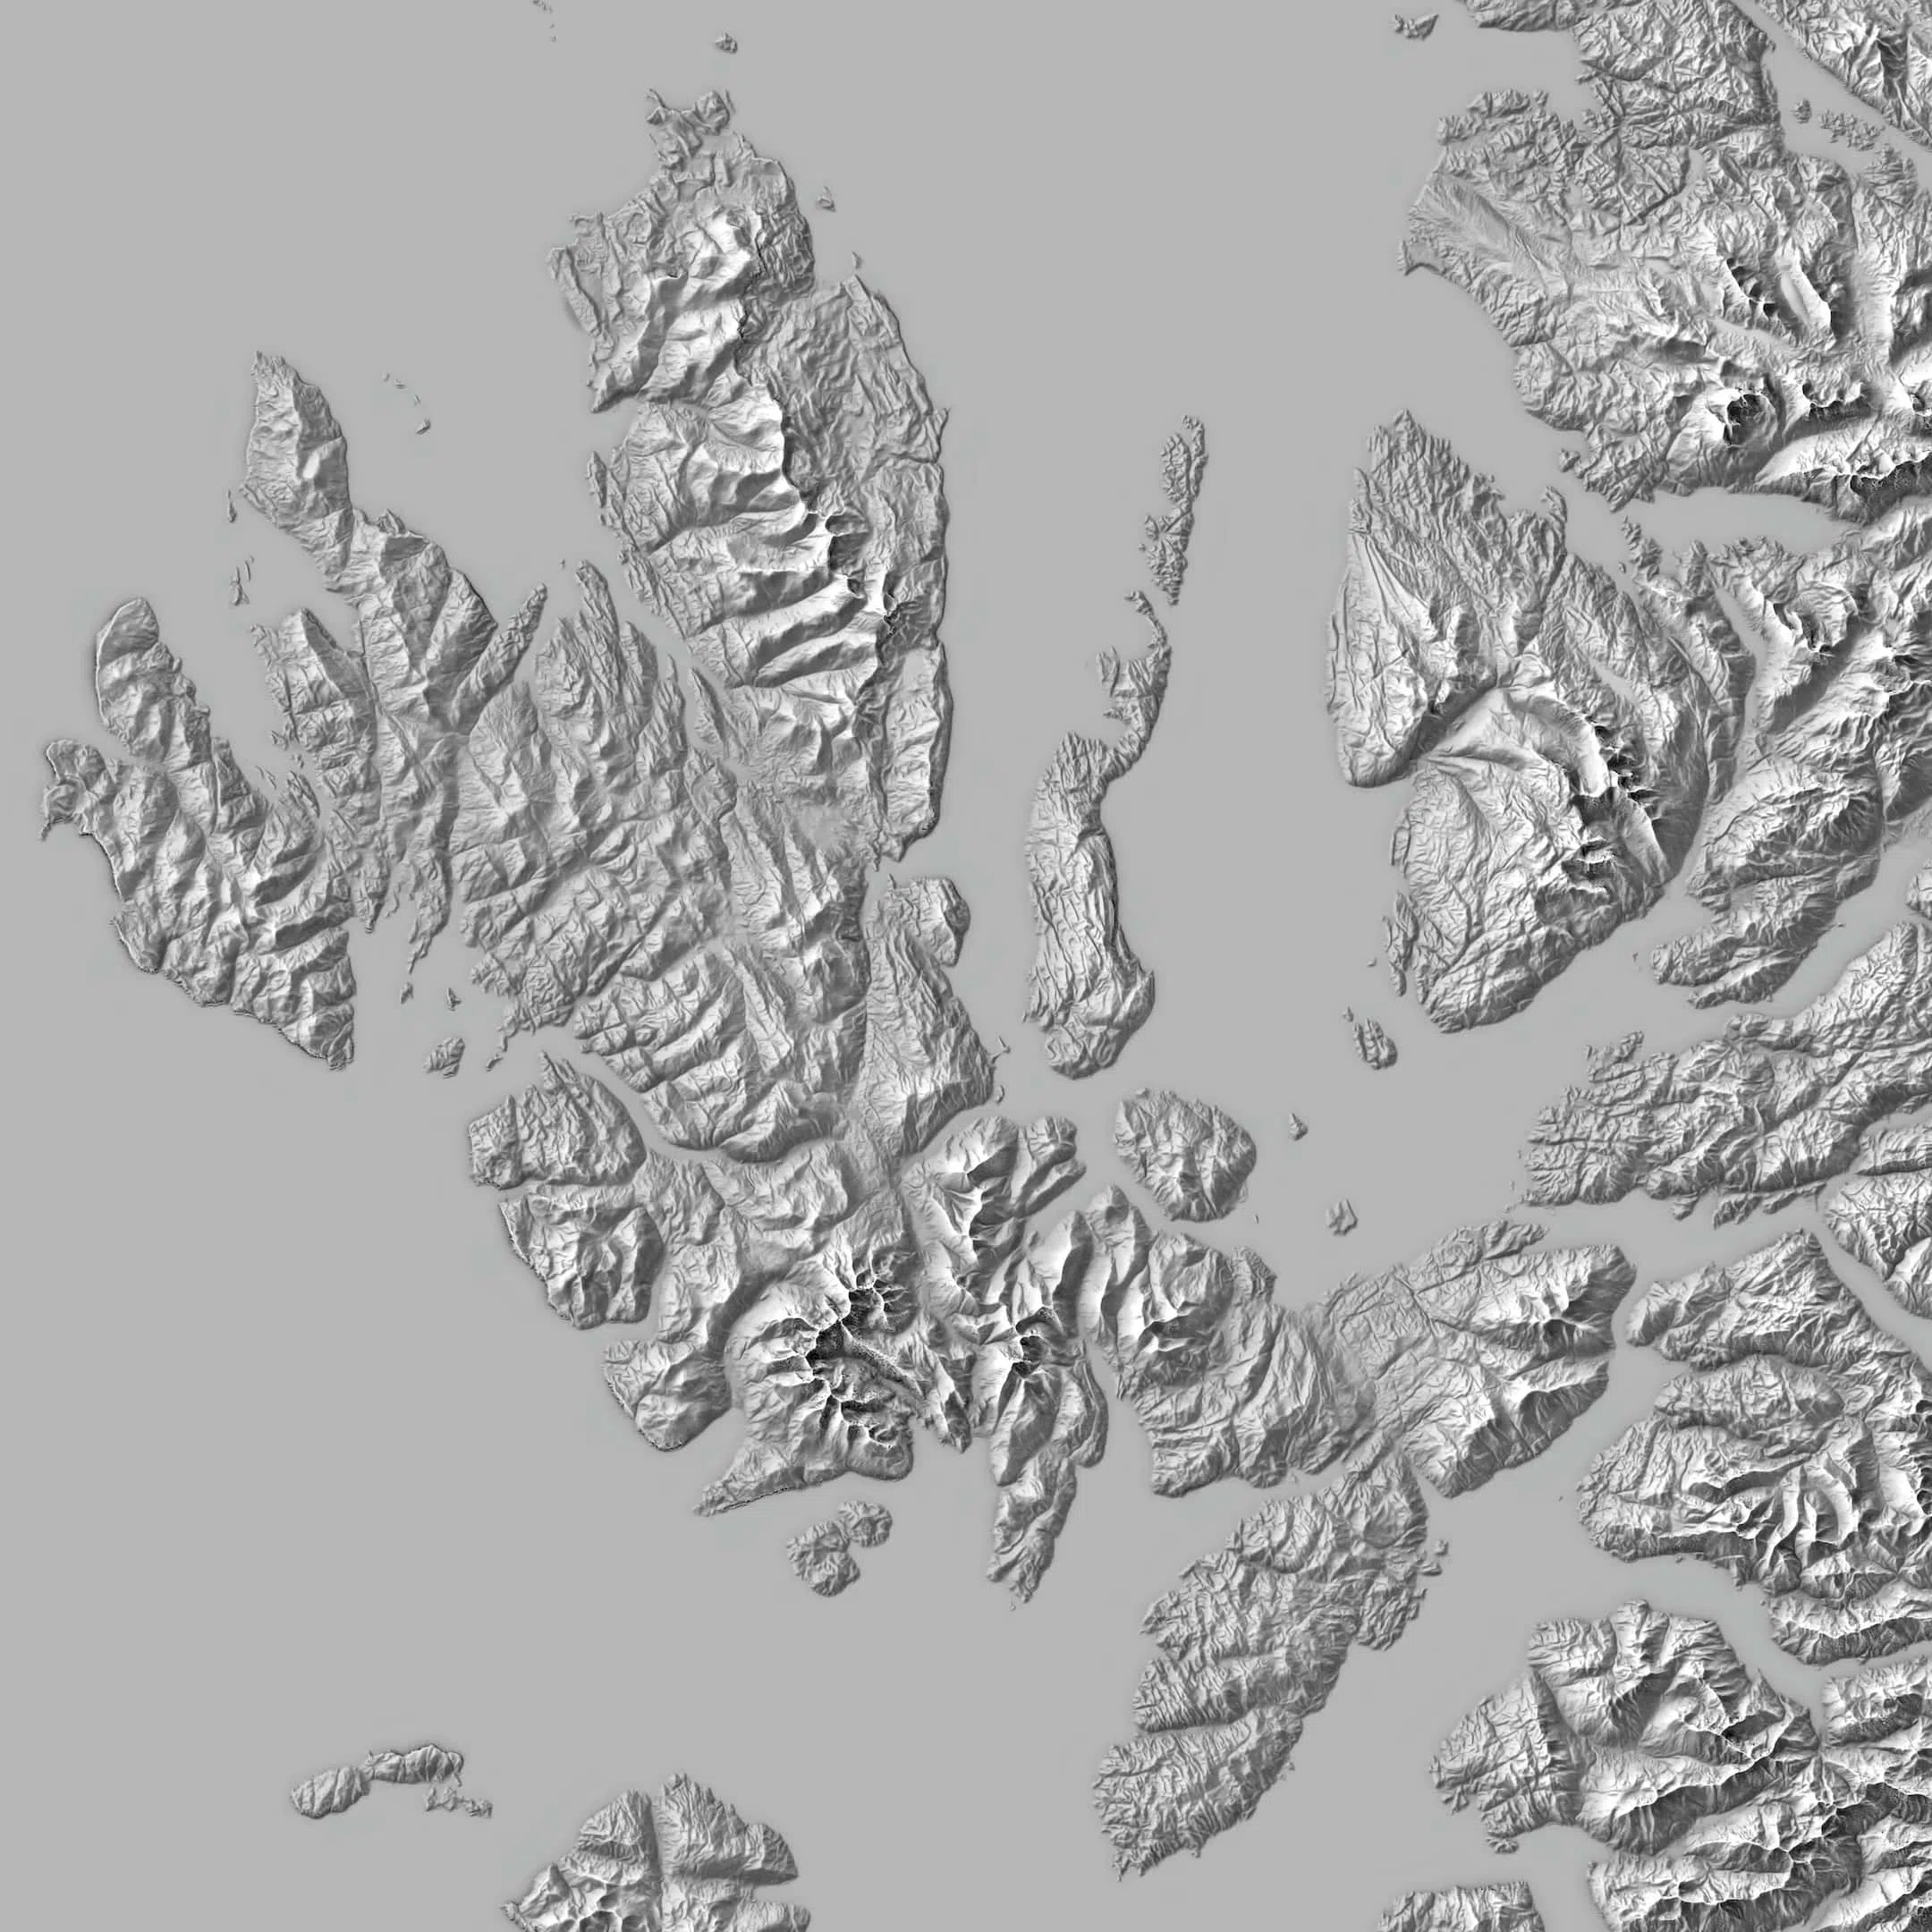
The Isle of Skye, Scotland. Inspired by the pioneering work of Swiss cartographer, Eduard Imhoff, the ‘Swiss style’ can have a subtlety and beauty that is the antithesis of the hyper exaggerated and unrealistic relief maps that we see endlessly repeated on social media platforms.

Glasgow, Scotland. A common technique in architectural, urban design and town planning practice. A simple but revealing representation of built form. The focus is on pattern and density. The city centre is self-evident and the course of the River Clyde reveals itself through its absence.
A fundamental tenet to much cartographic practice. It provides a mathematical framework to represent and analyze maps. Applying this network topology to a map enables the calculation of themes such as isolation, adjacency, connectivity and routing.
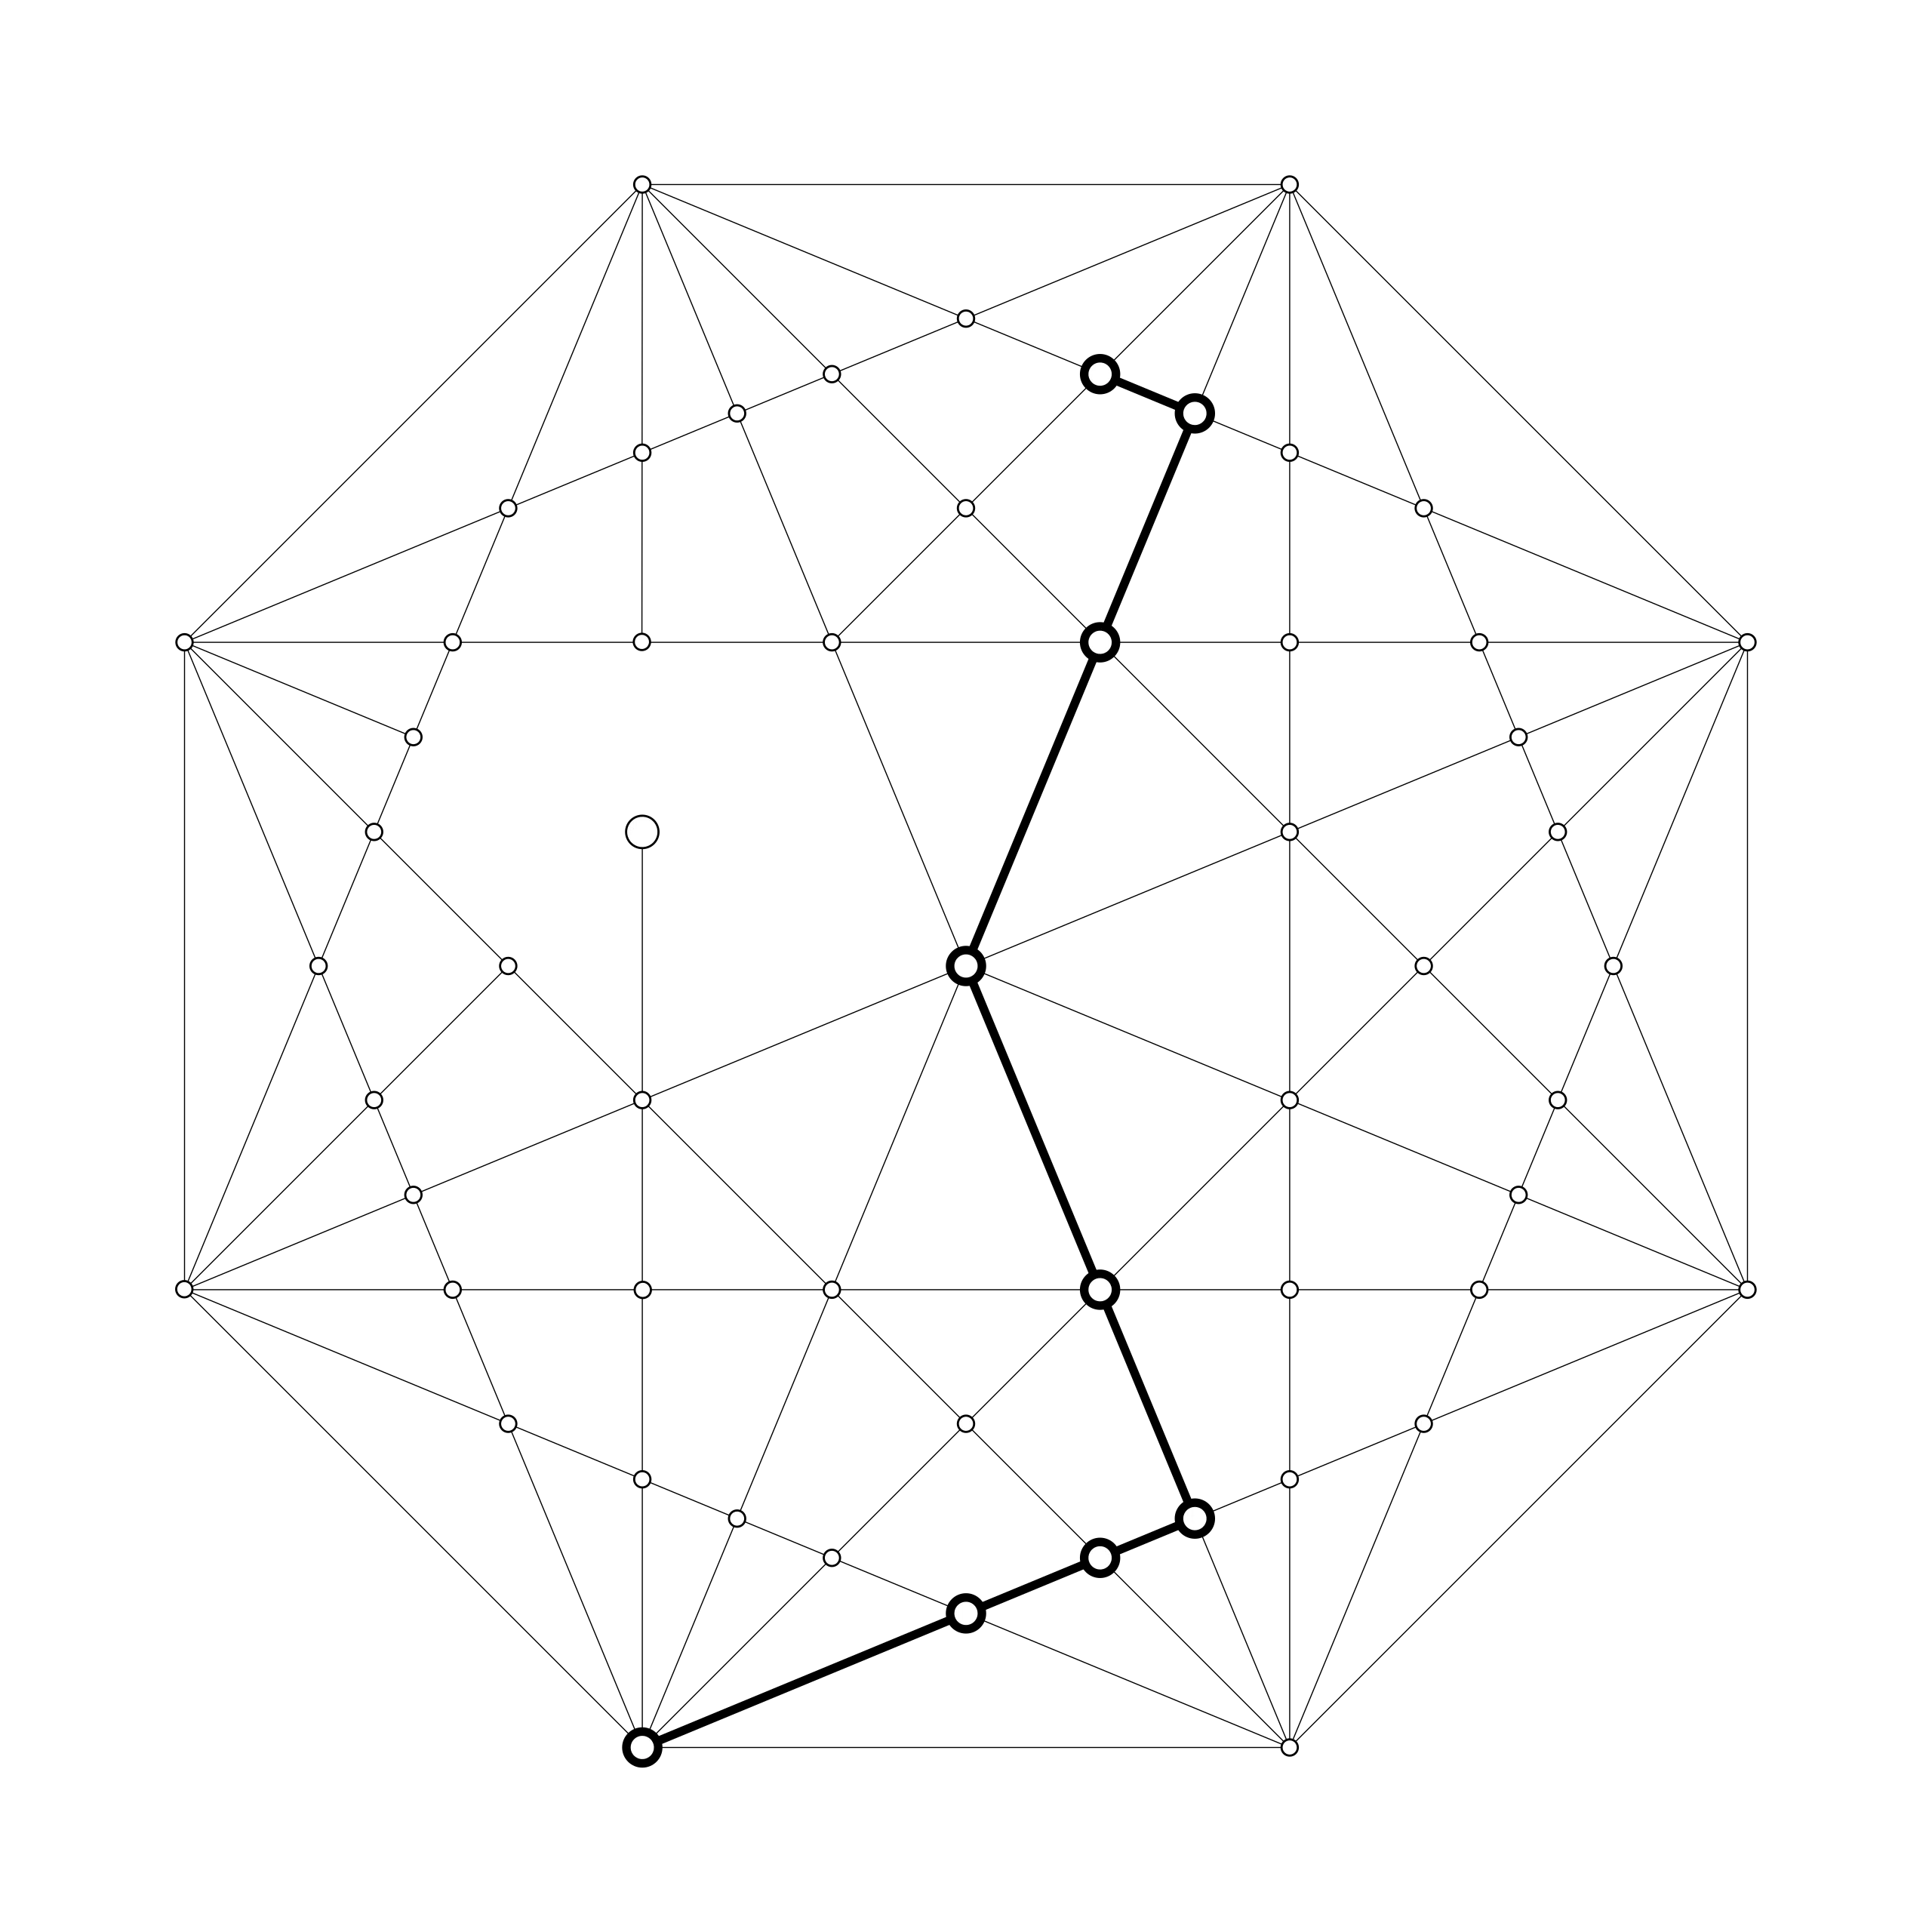
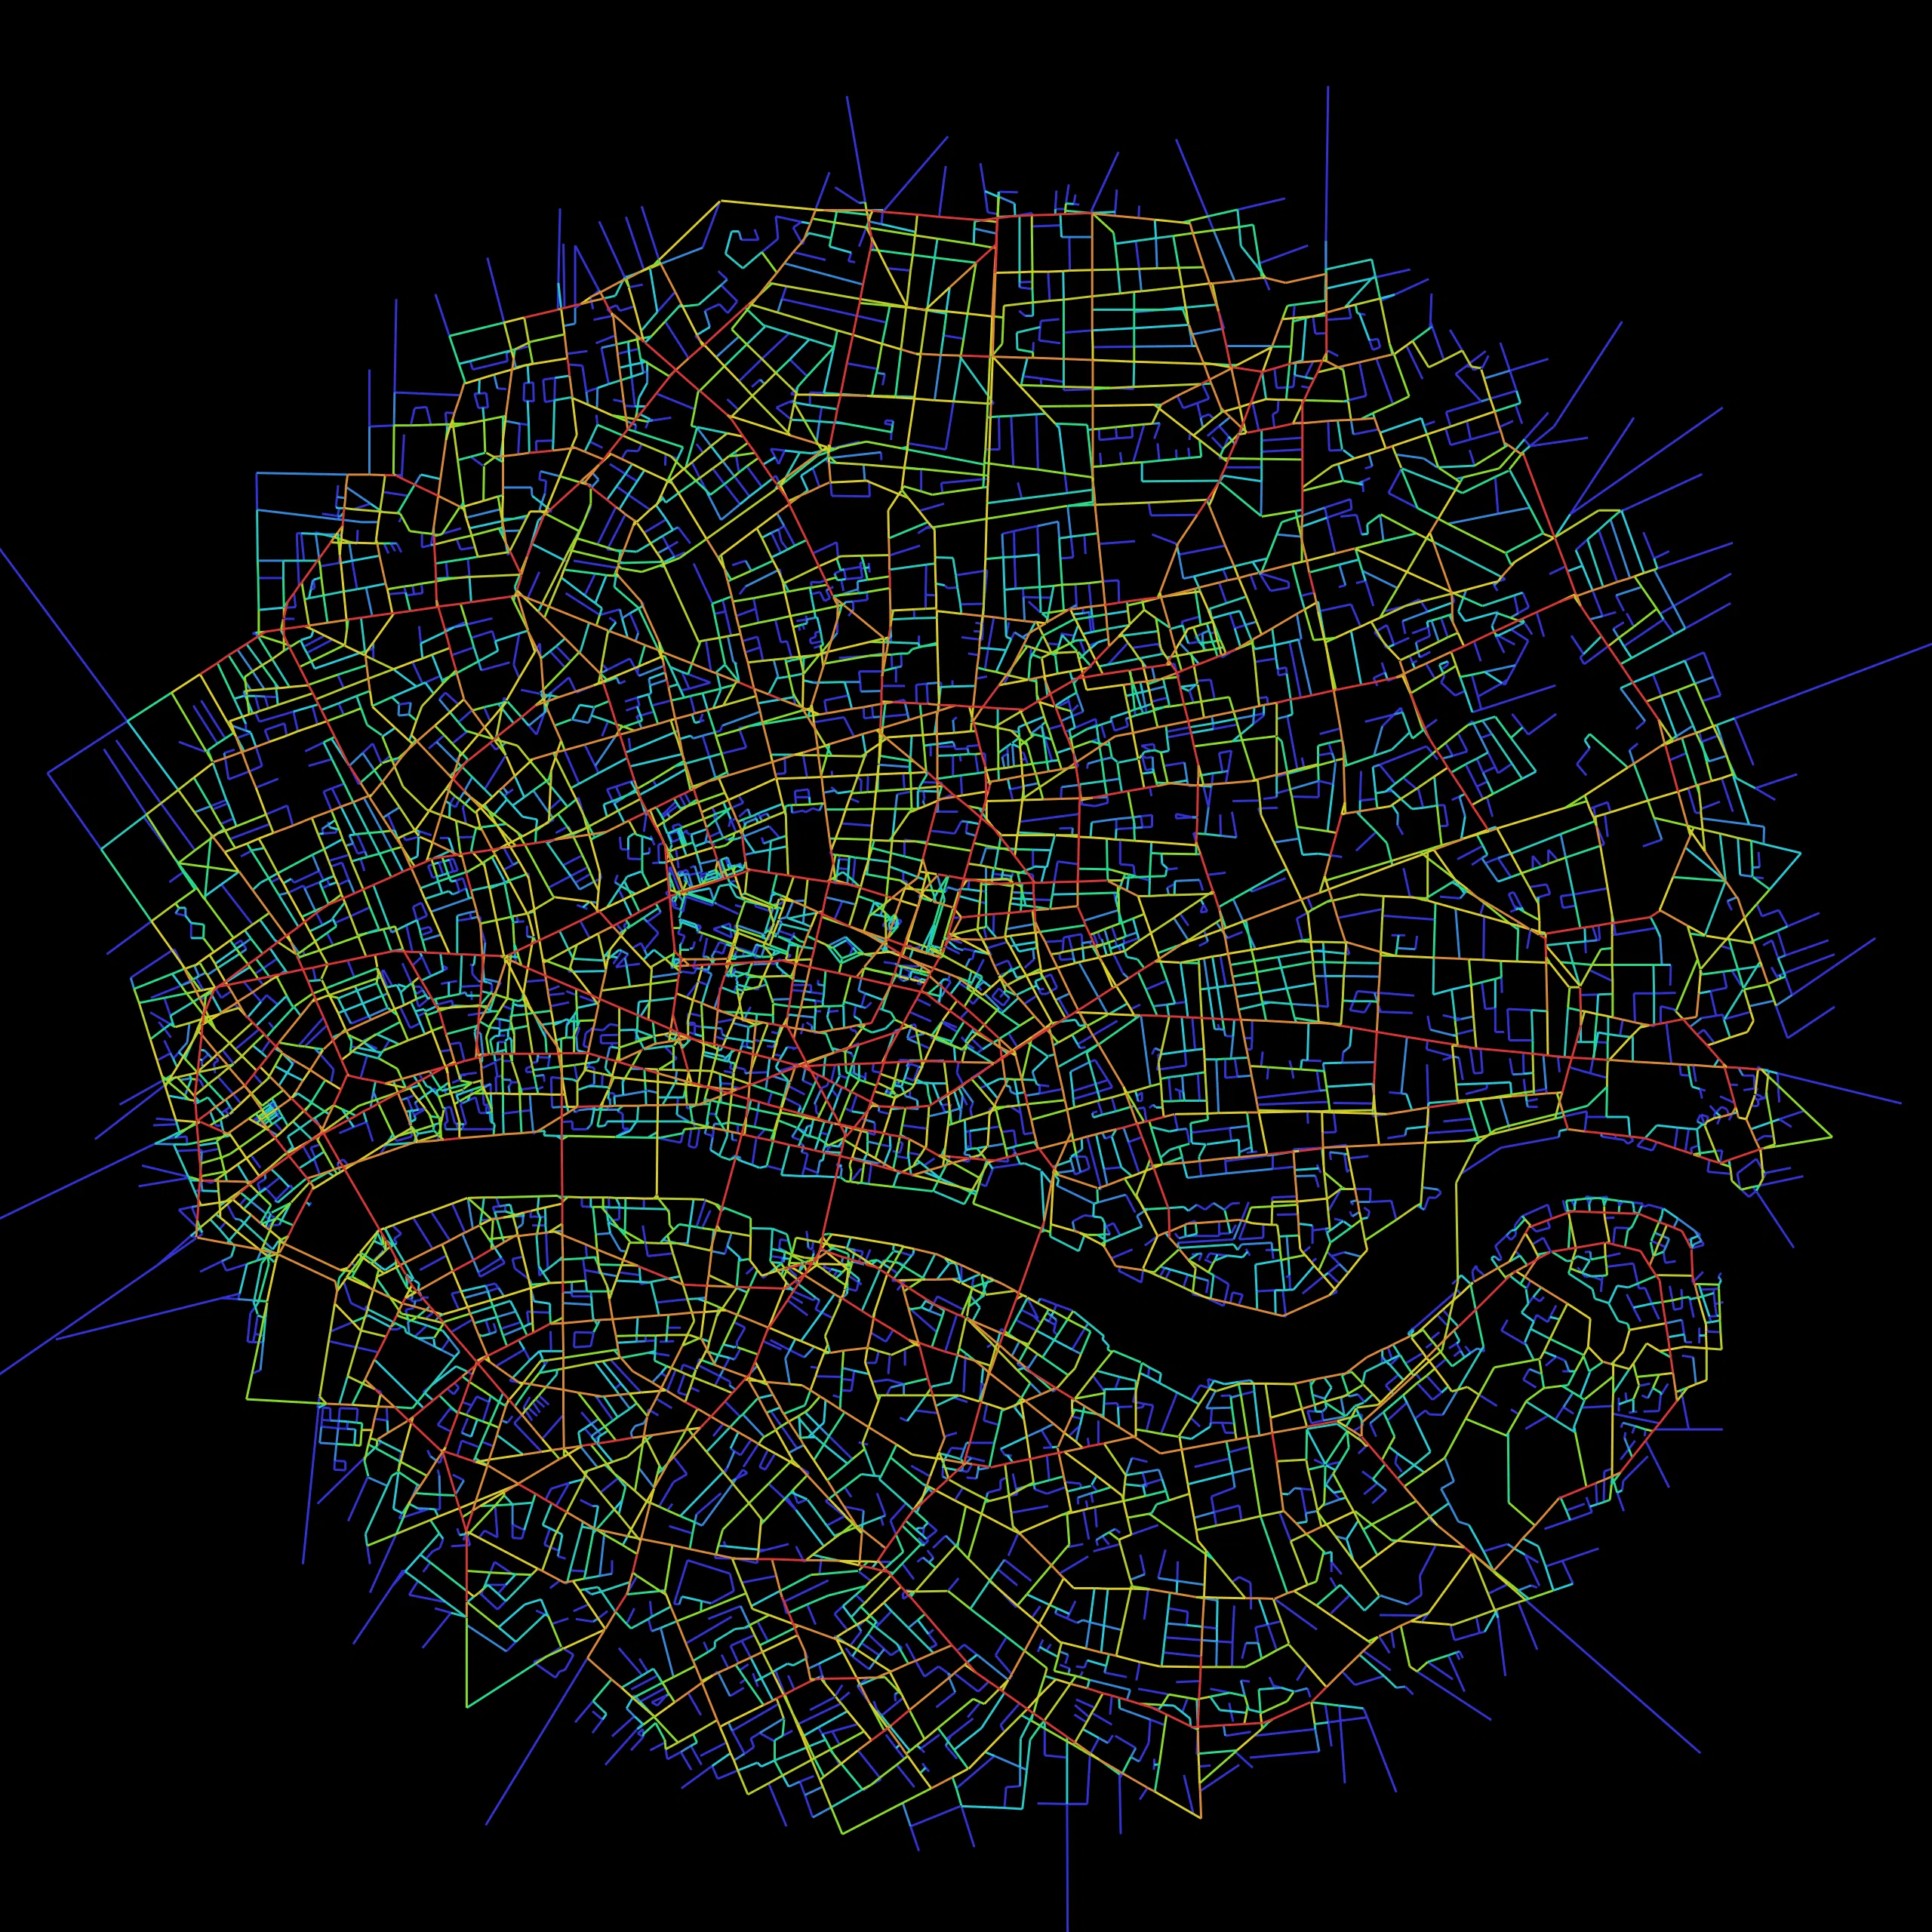
A direct application of graph theory, Space Syntax is a methodology for analysing space in terms of its network of connections and spaces, applying that to accessibility and movement, land use and economy, and other human interactions with space.
A foundational principle in cartographic abstraction to reduce and clarify the information on a map for a given scale and audience. It utilizes processes such as selection, aggregation, classification, exaggeration, displacement, merging, smoothing, simplification and refinement.

Another of the foundational principles in cartographic abstraction. It exists to reduce and clarify the geometric information on a map for a given scale and audience without sacrificing topological relationships or geographical cognition.
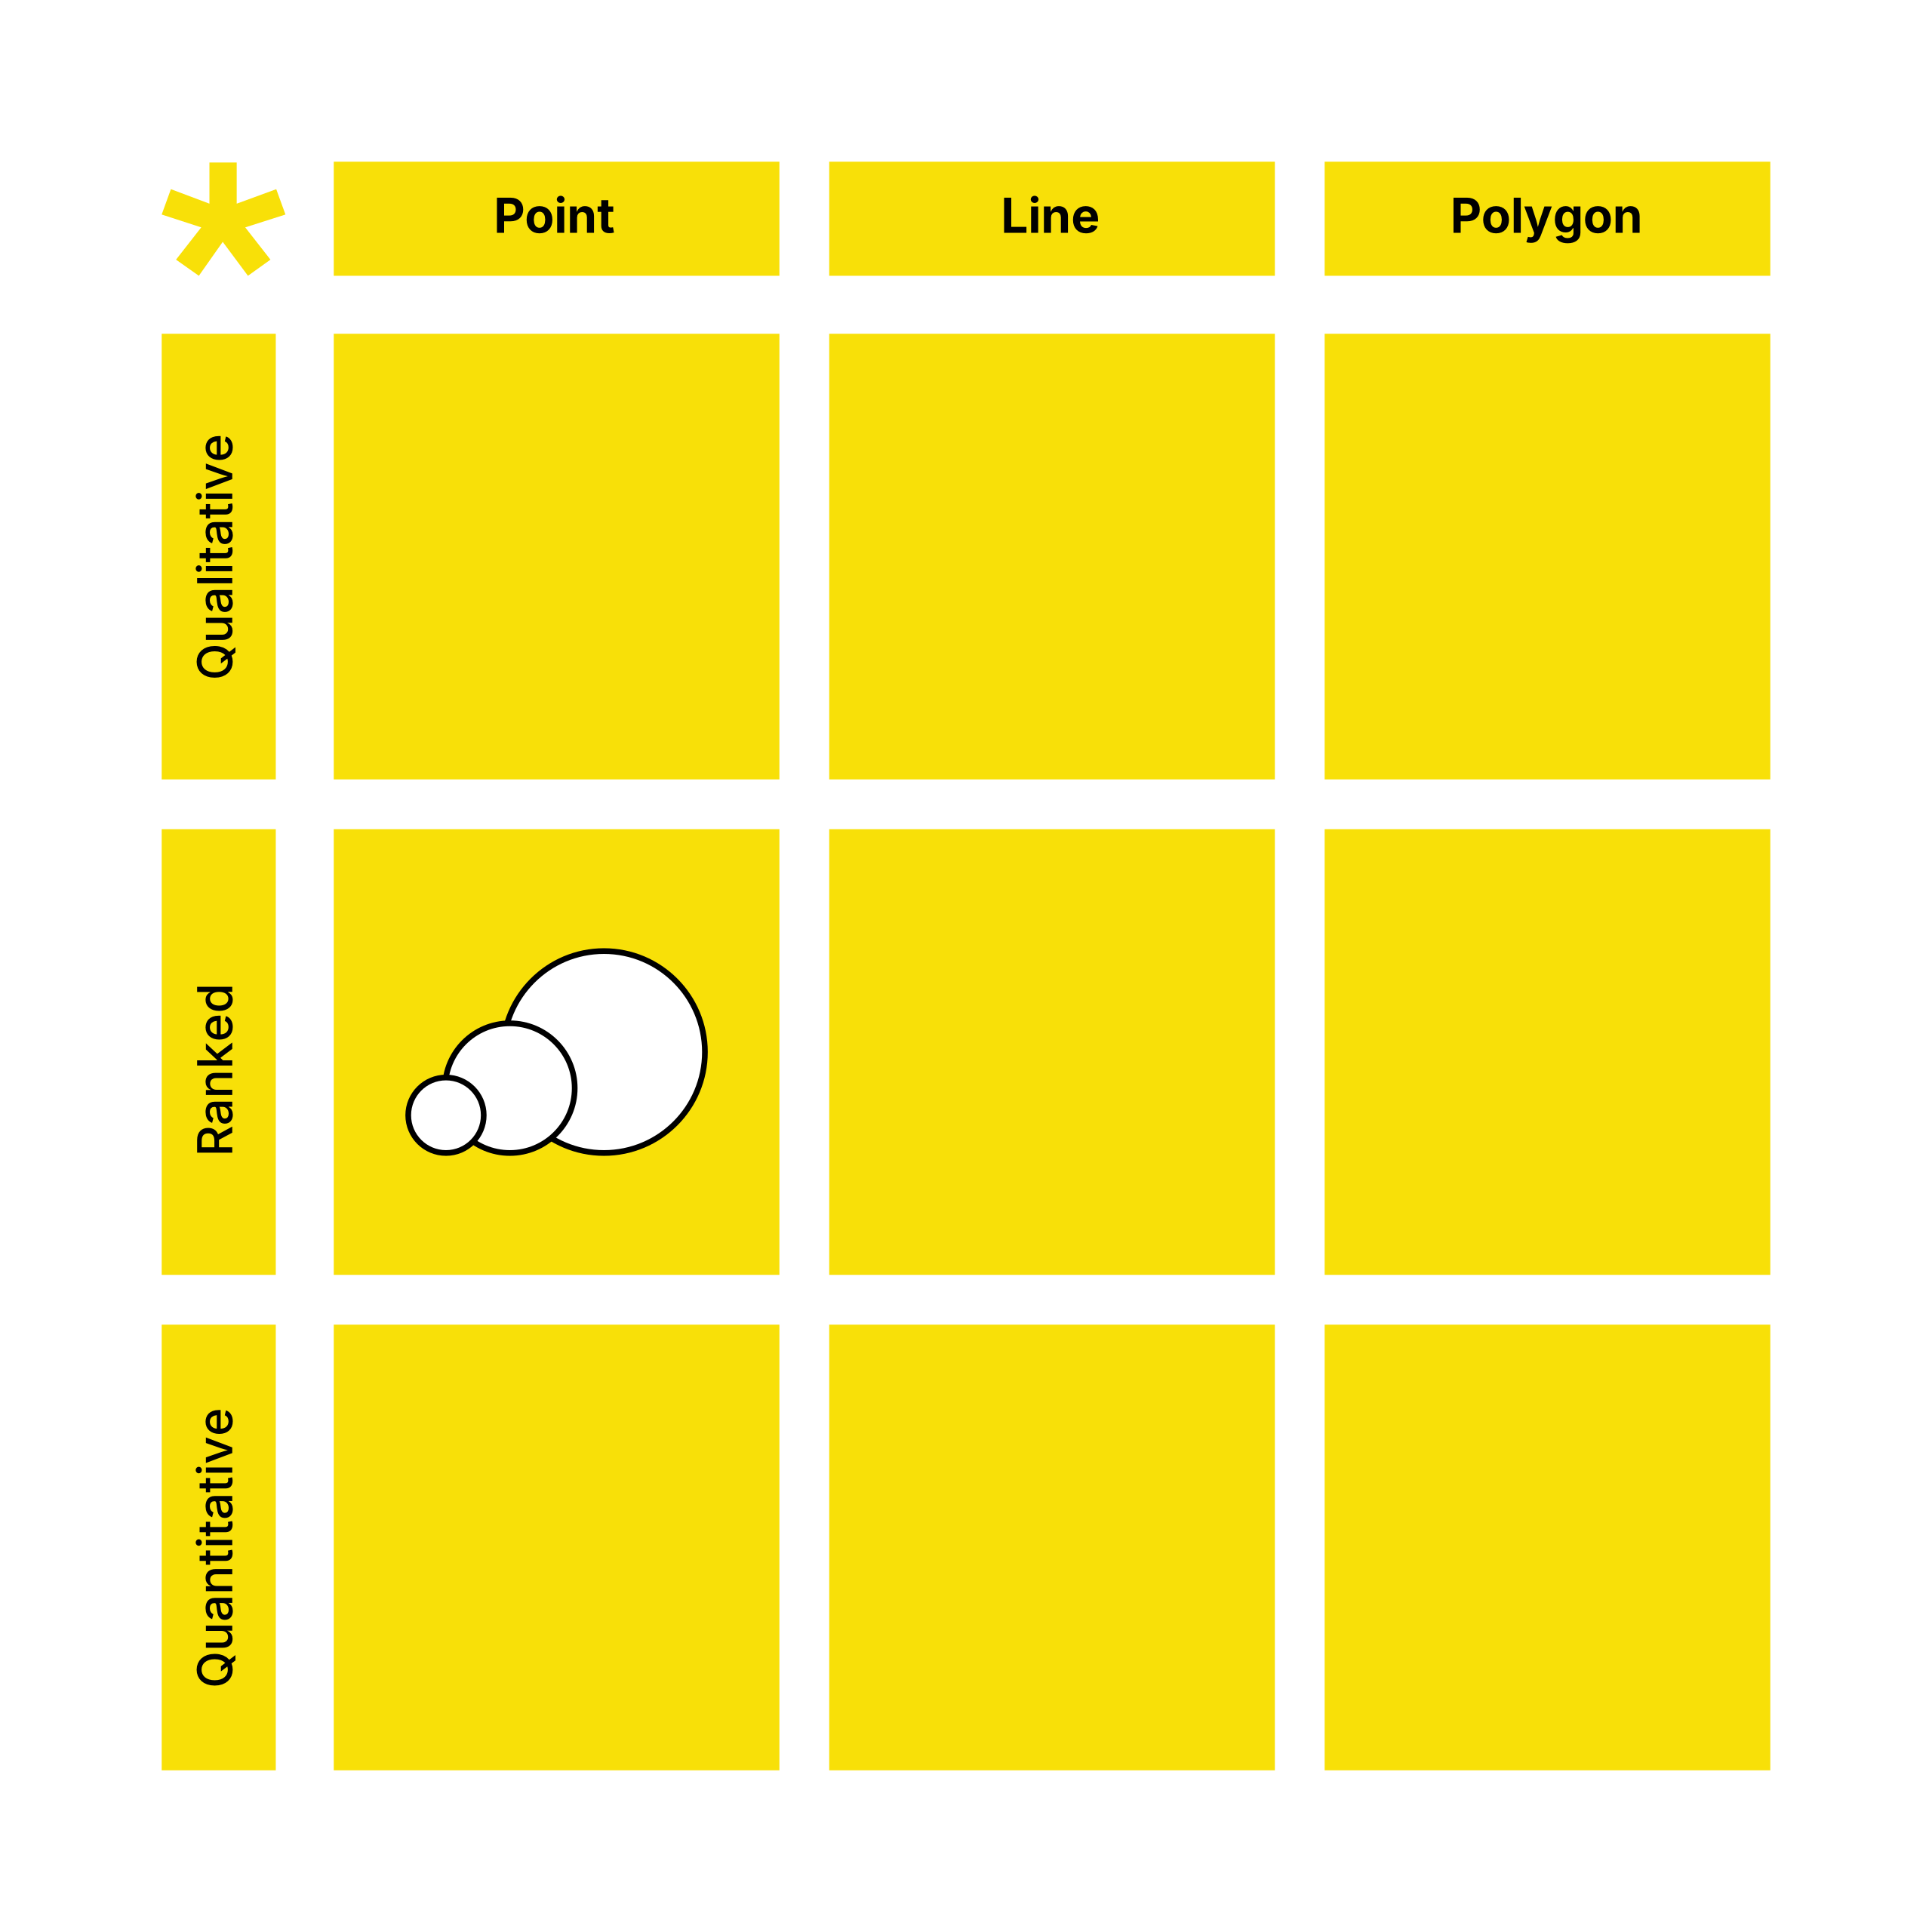
Of the two broad models for displaying geospatial data—vector and raster—the former is always constructed of these three types of discrete geometric objects. A simple way of understanding a map and its data types.
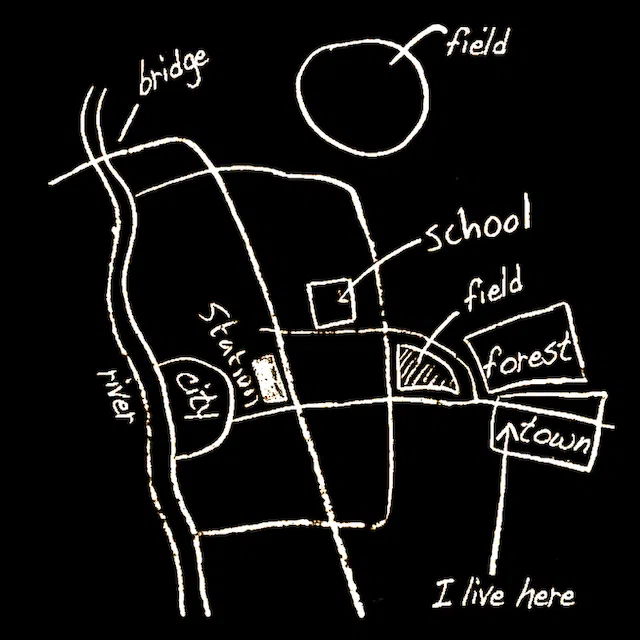
We all have this, and unique to each of us. Maps and experience enable us to develop a personal spatial understanding of the world around us, constructed in our minds, also called mental maps. It's rarely accurate, geographically, but good enough to enable us to get from A–B, or have a sense place.
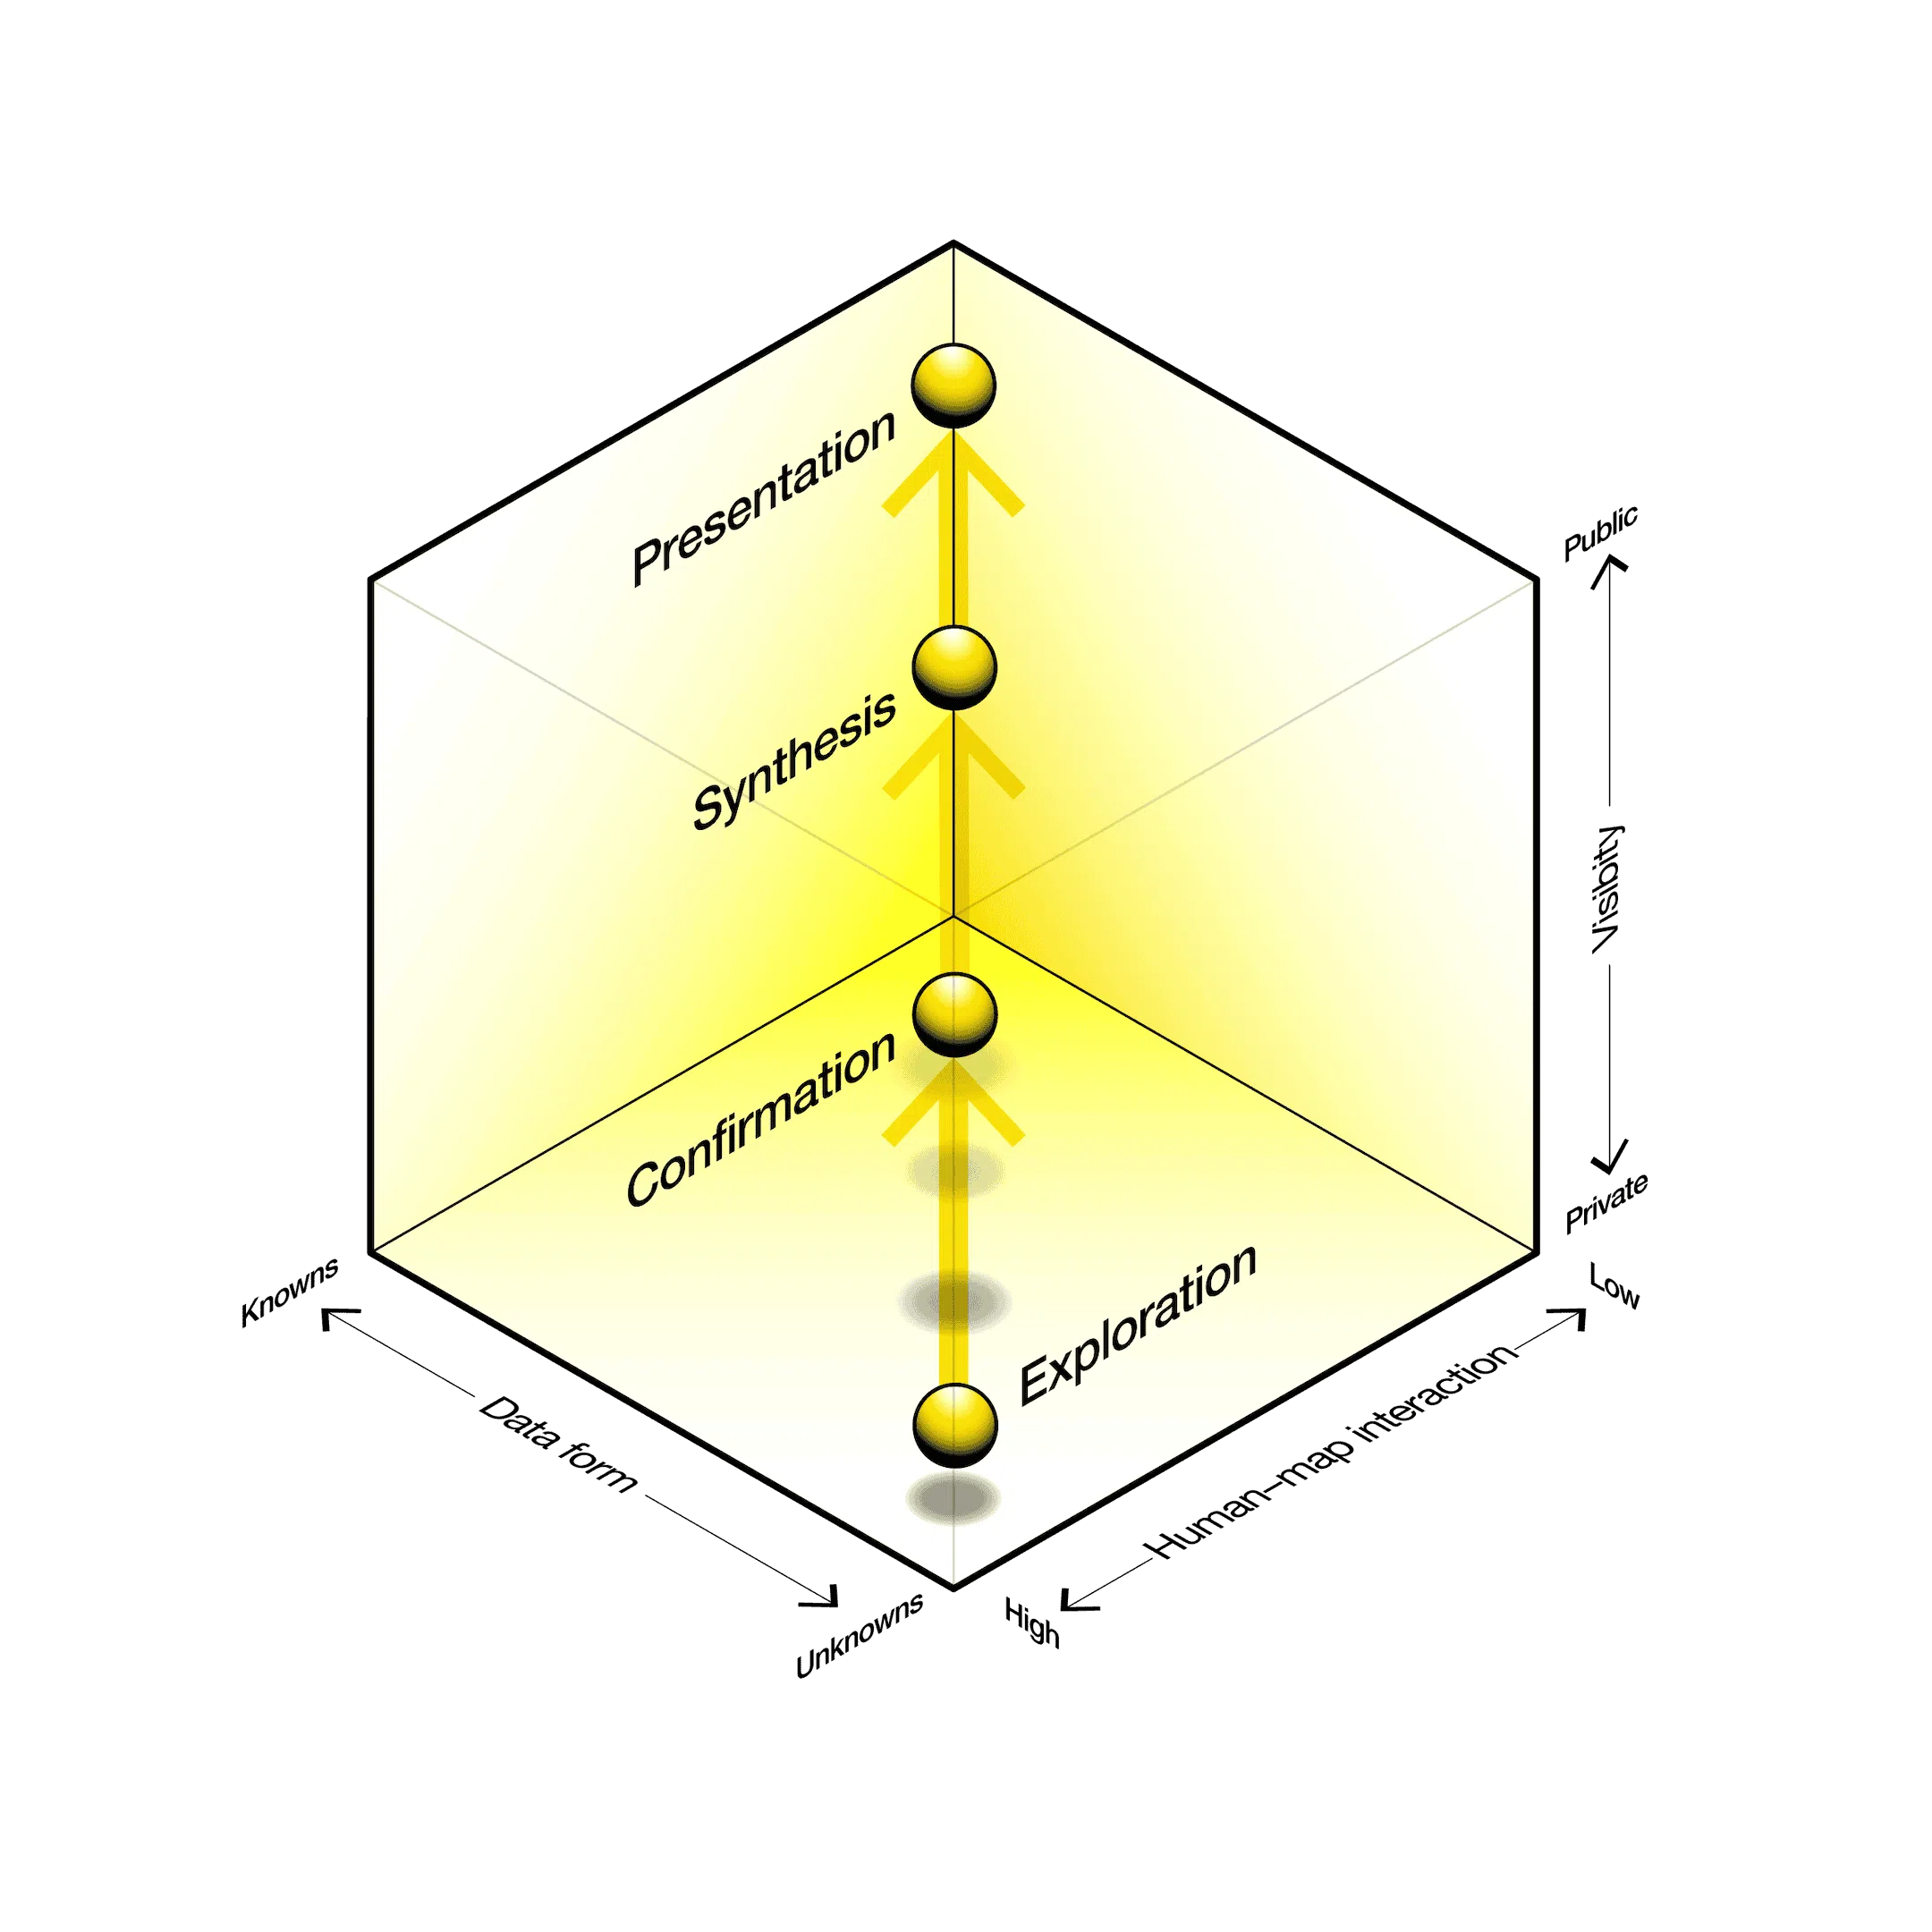
Cartography³ (cubed) is a well-cited model in cartography, first conceived by Alan MacEachren in 1994. With particular reference to thematic mapping, it was designed to illustrate the different purposes a map may have, how it may be used, by whom, and the cognitive process involved.
A fundamental method of dealing with information density, allowing the map reader to filter and dig down through many layers of information.
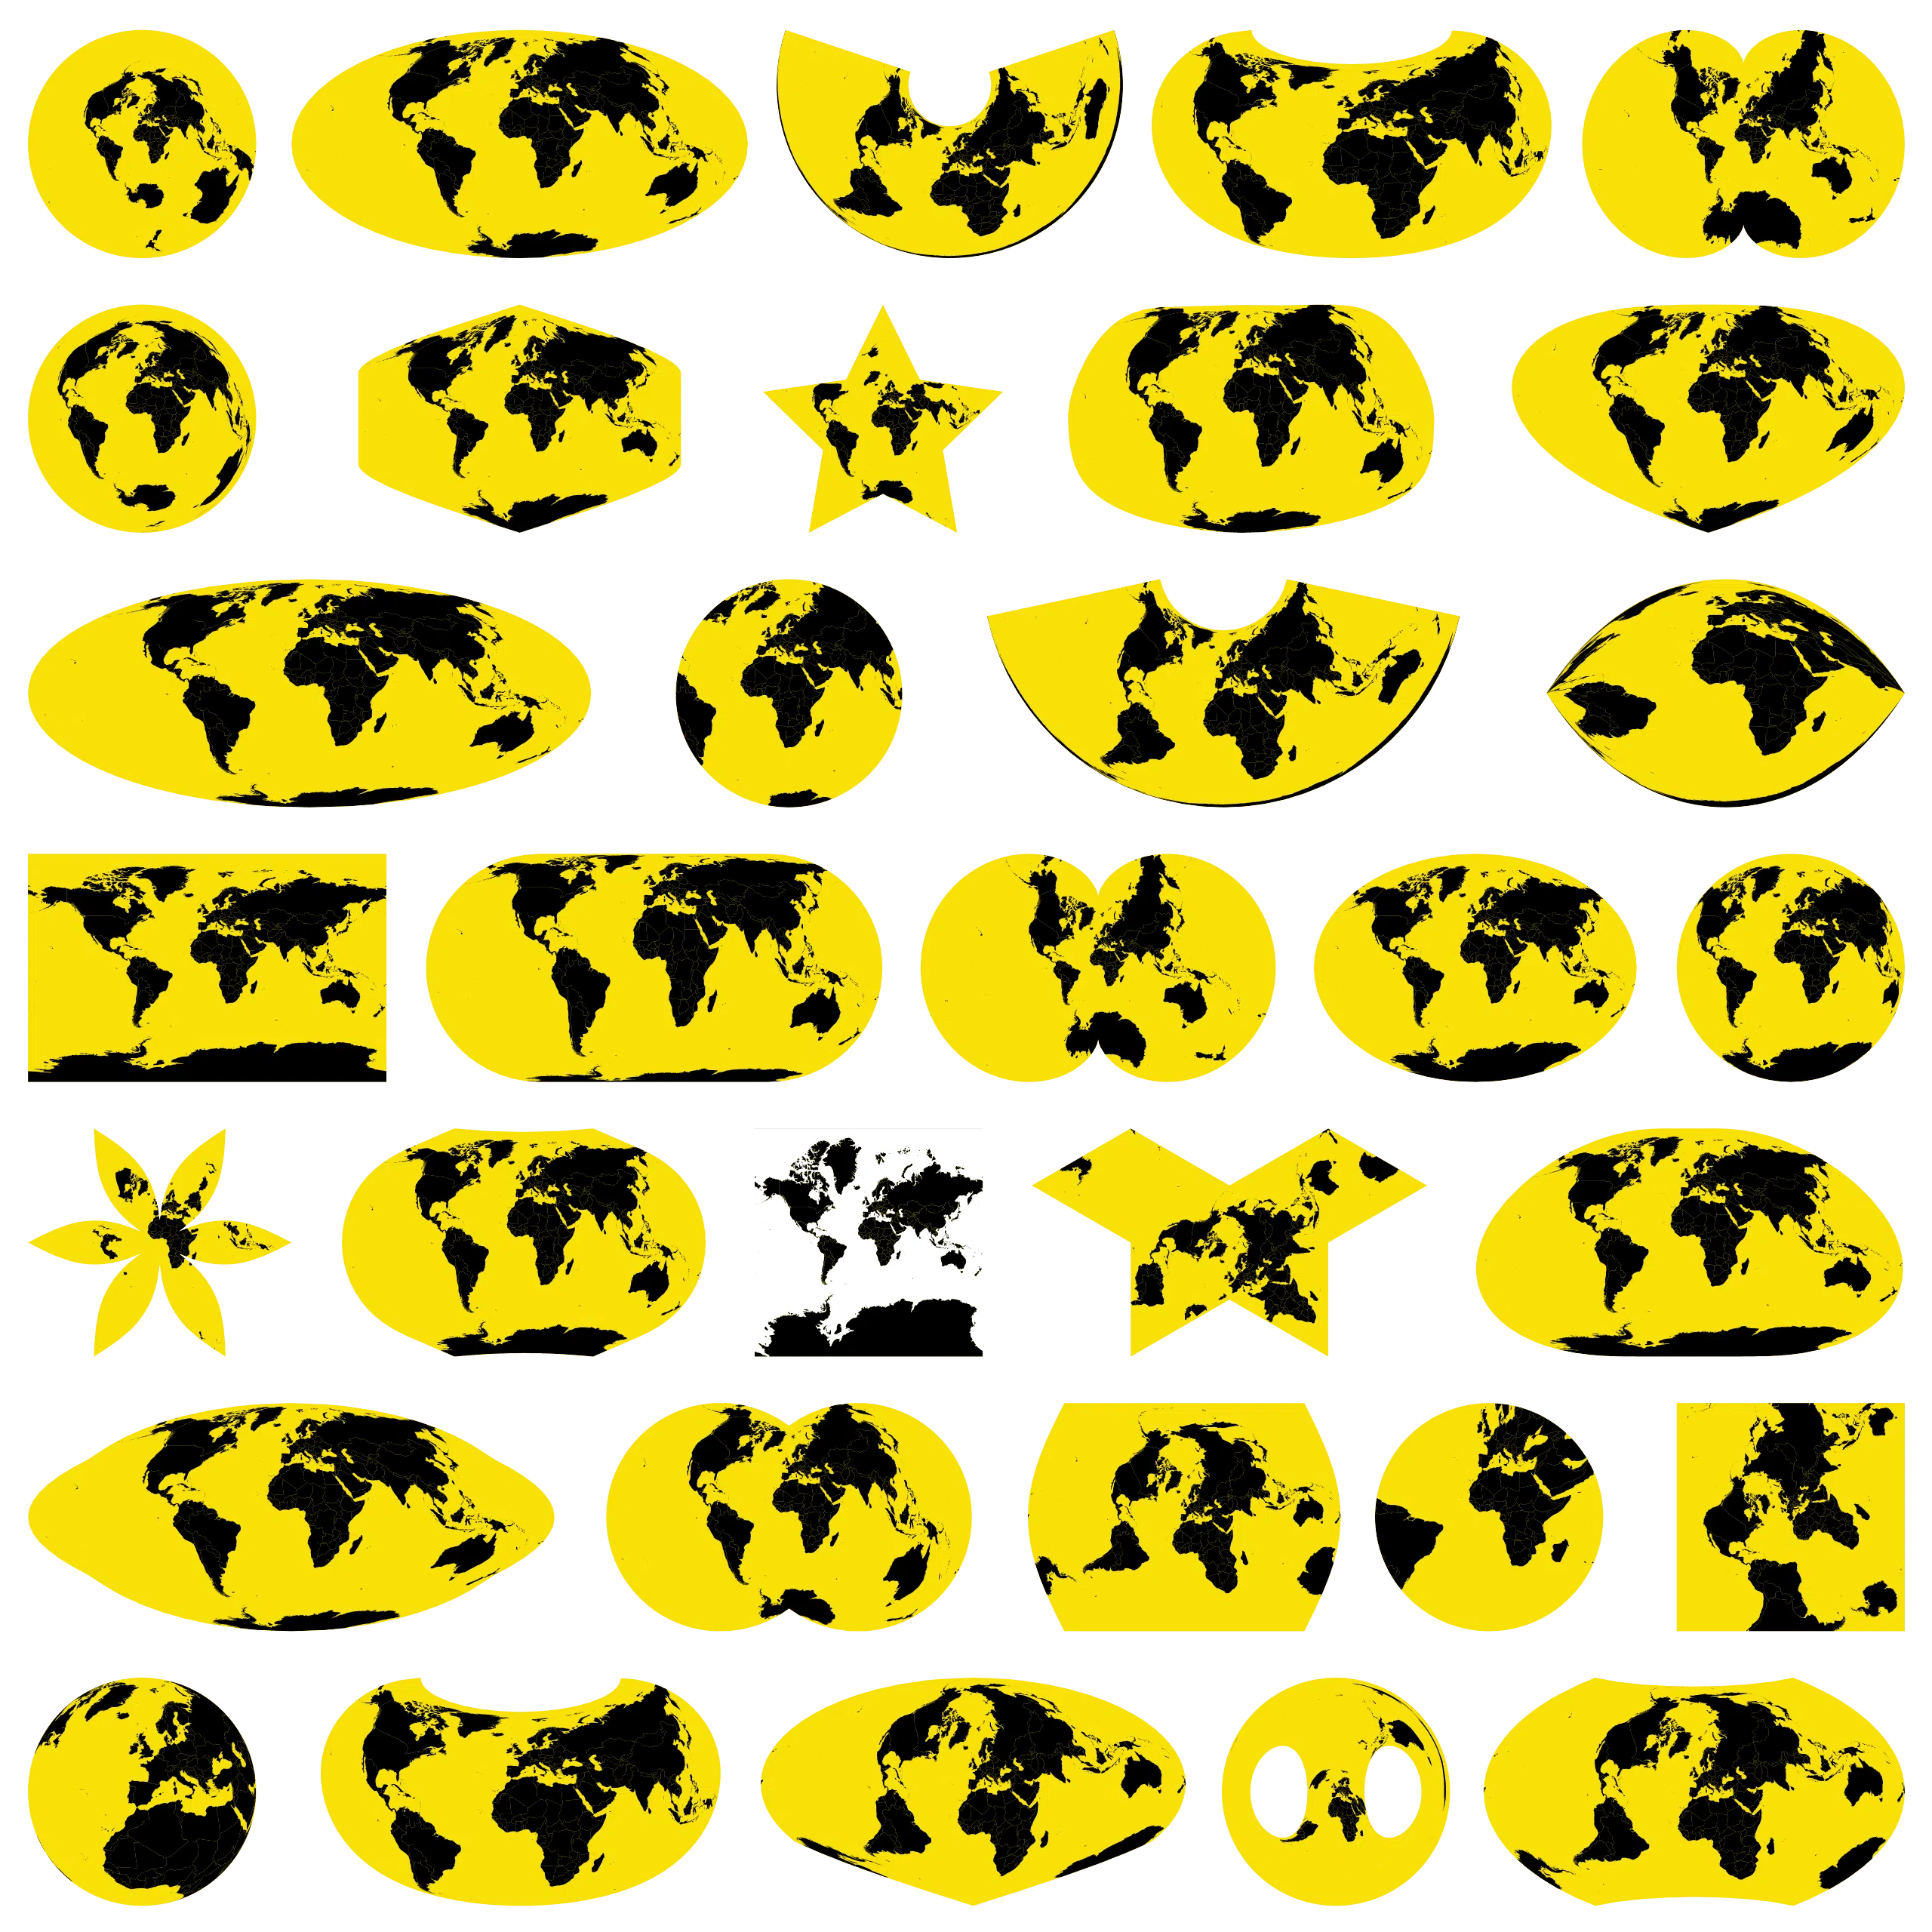
The world isn’t flat! There are in fact in excess of 80 different map projections that attempt to translate our 3D world into 2D space. Unfortunately, most of us are only familiar with the Mercator projection (white background), which has somewhat distorted our understanding of global geography. Great for marine navigation, but not for other themes.
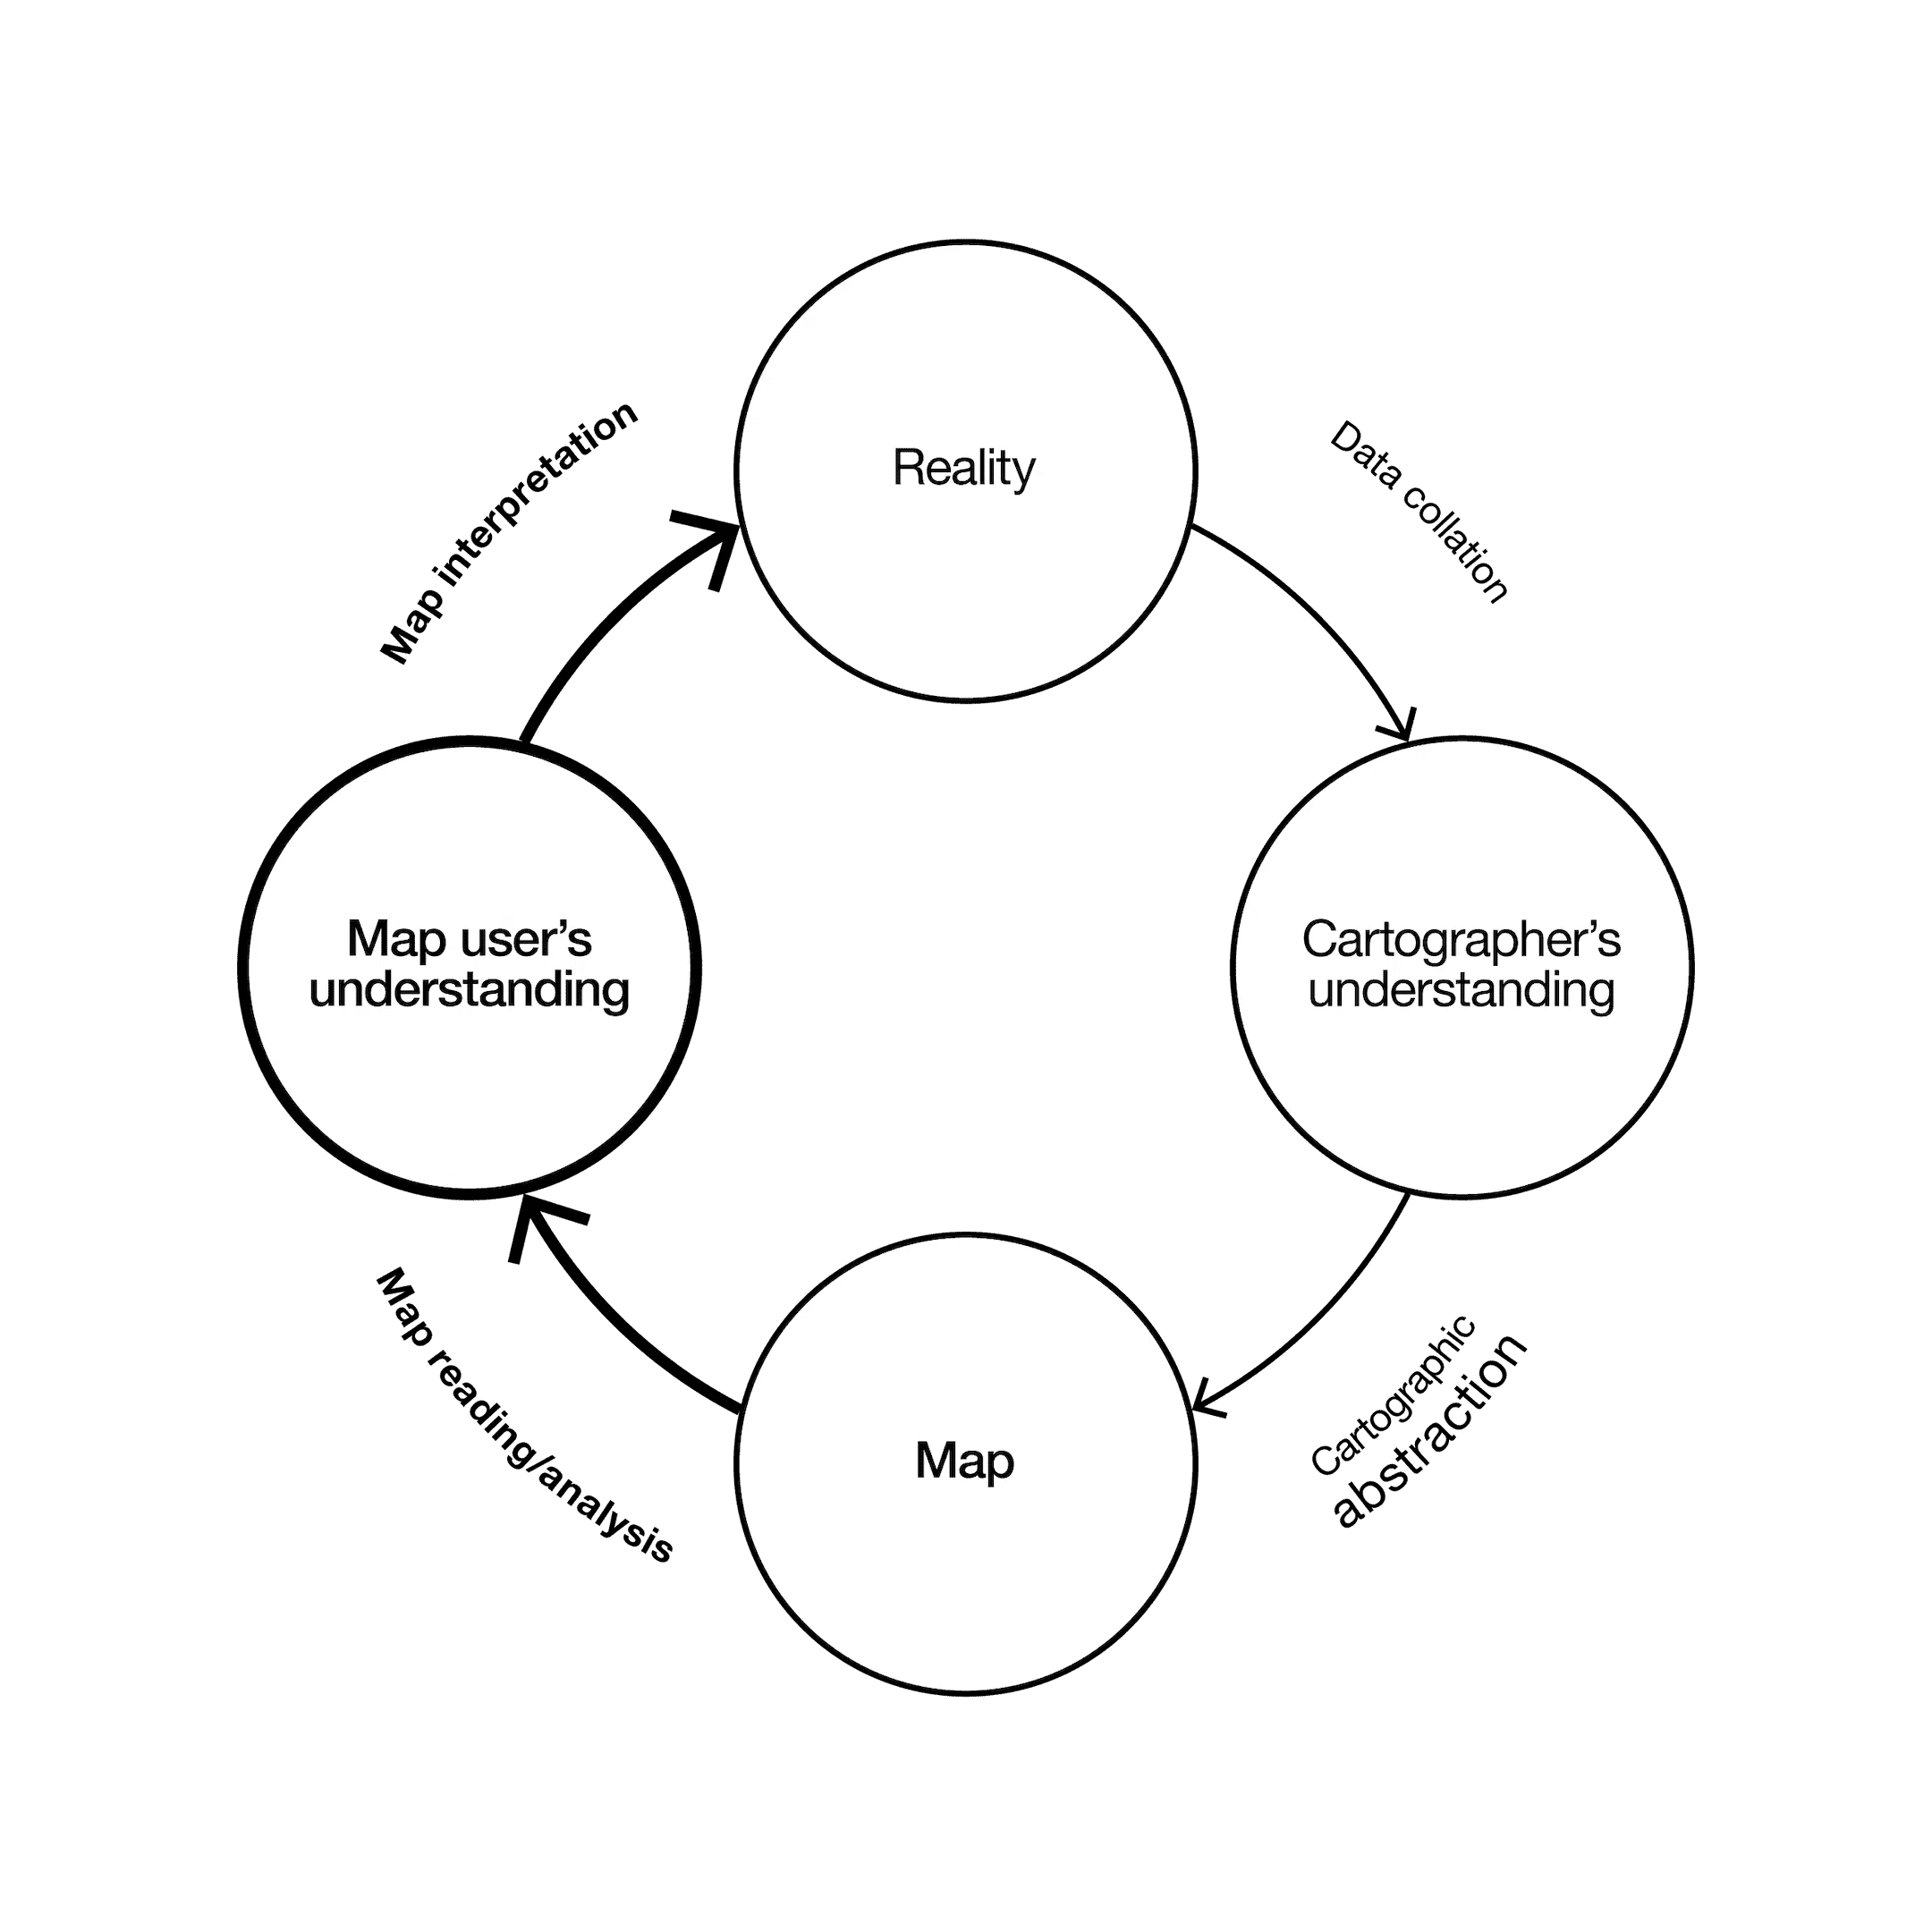
Analogous to literacy, numeracy and articulacy, and arguably just as important, graphicacy is a characterisation of cartographic and other visuo-spatial abilities, extending across the whole field of graphical communications; a form of spatial intelligence.
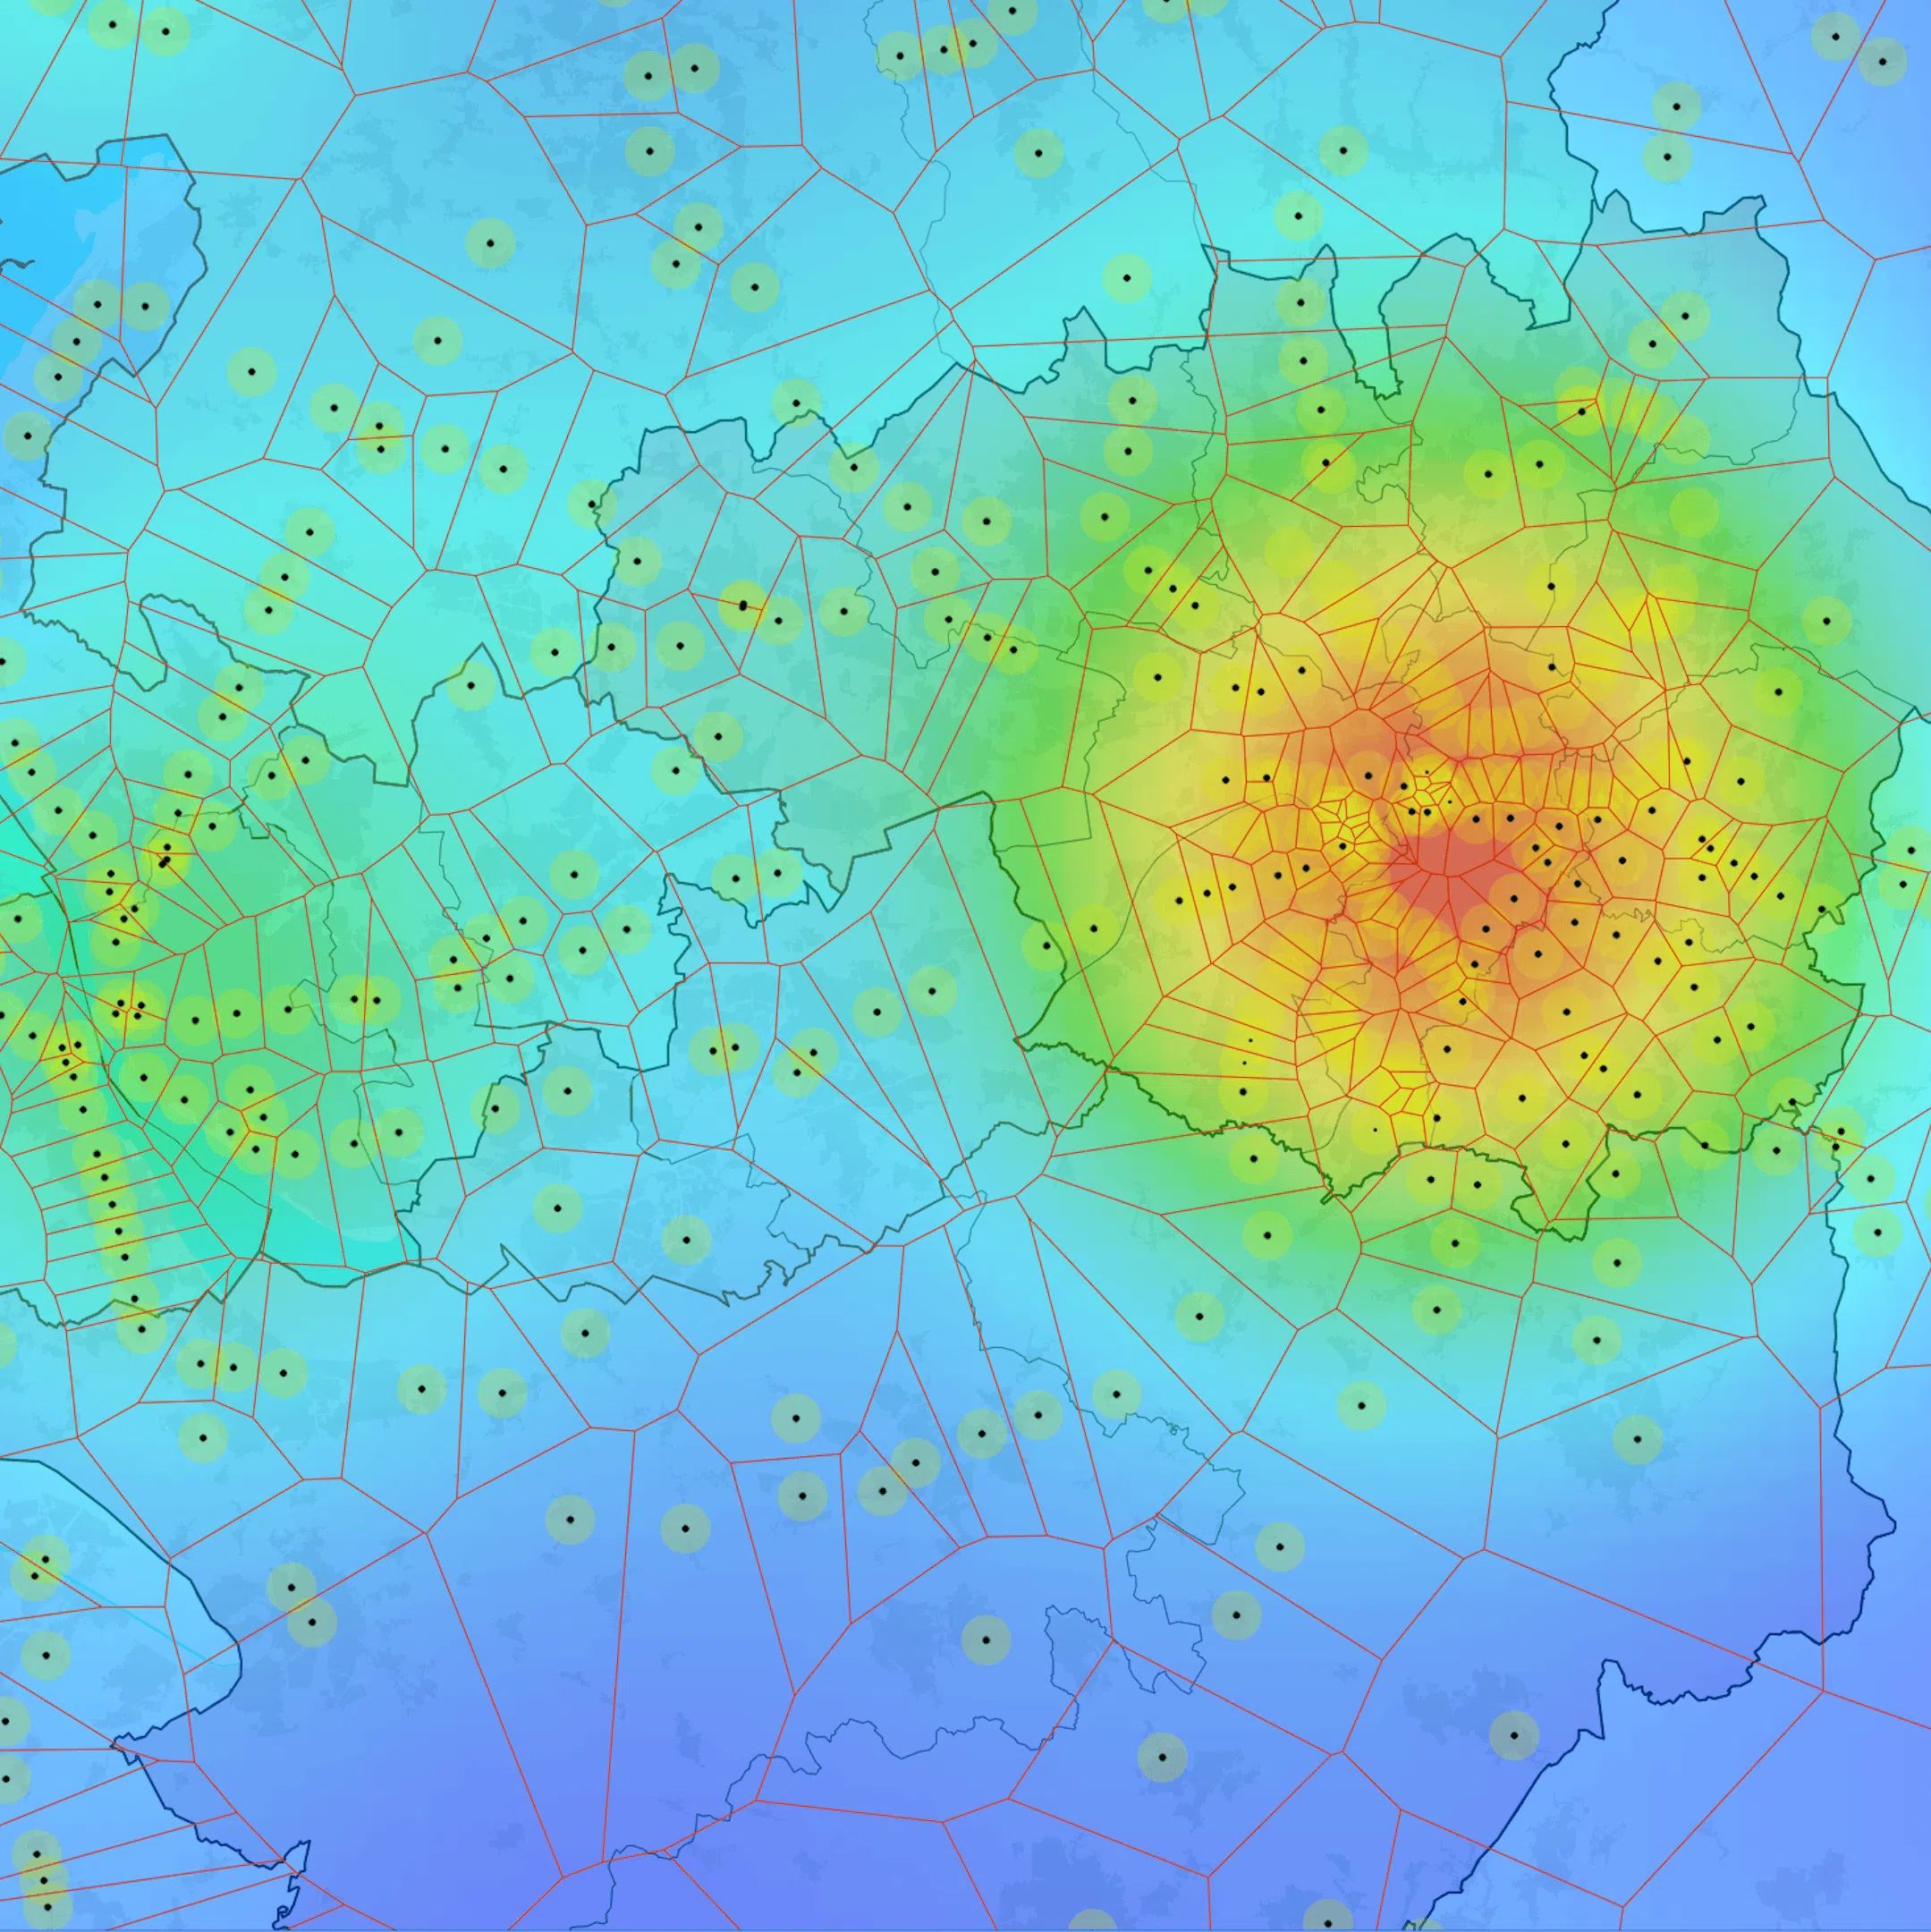
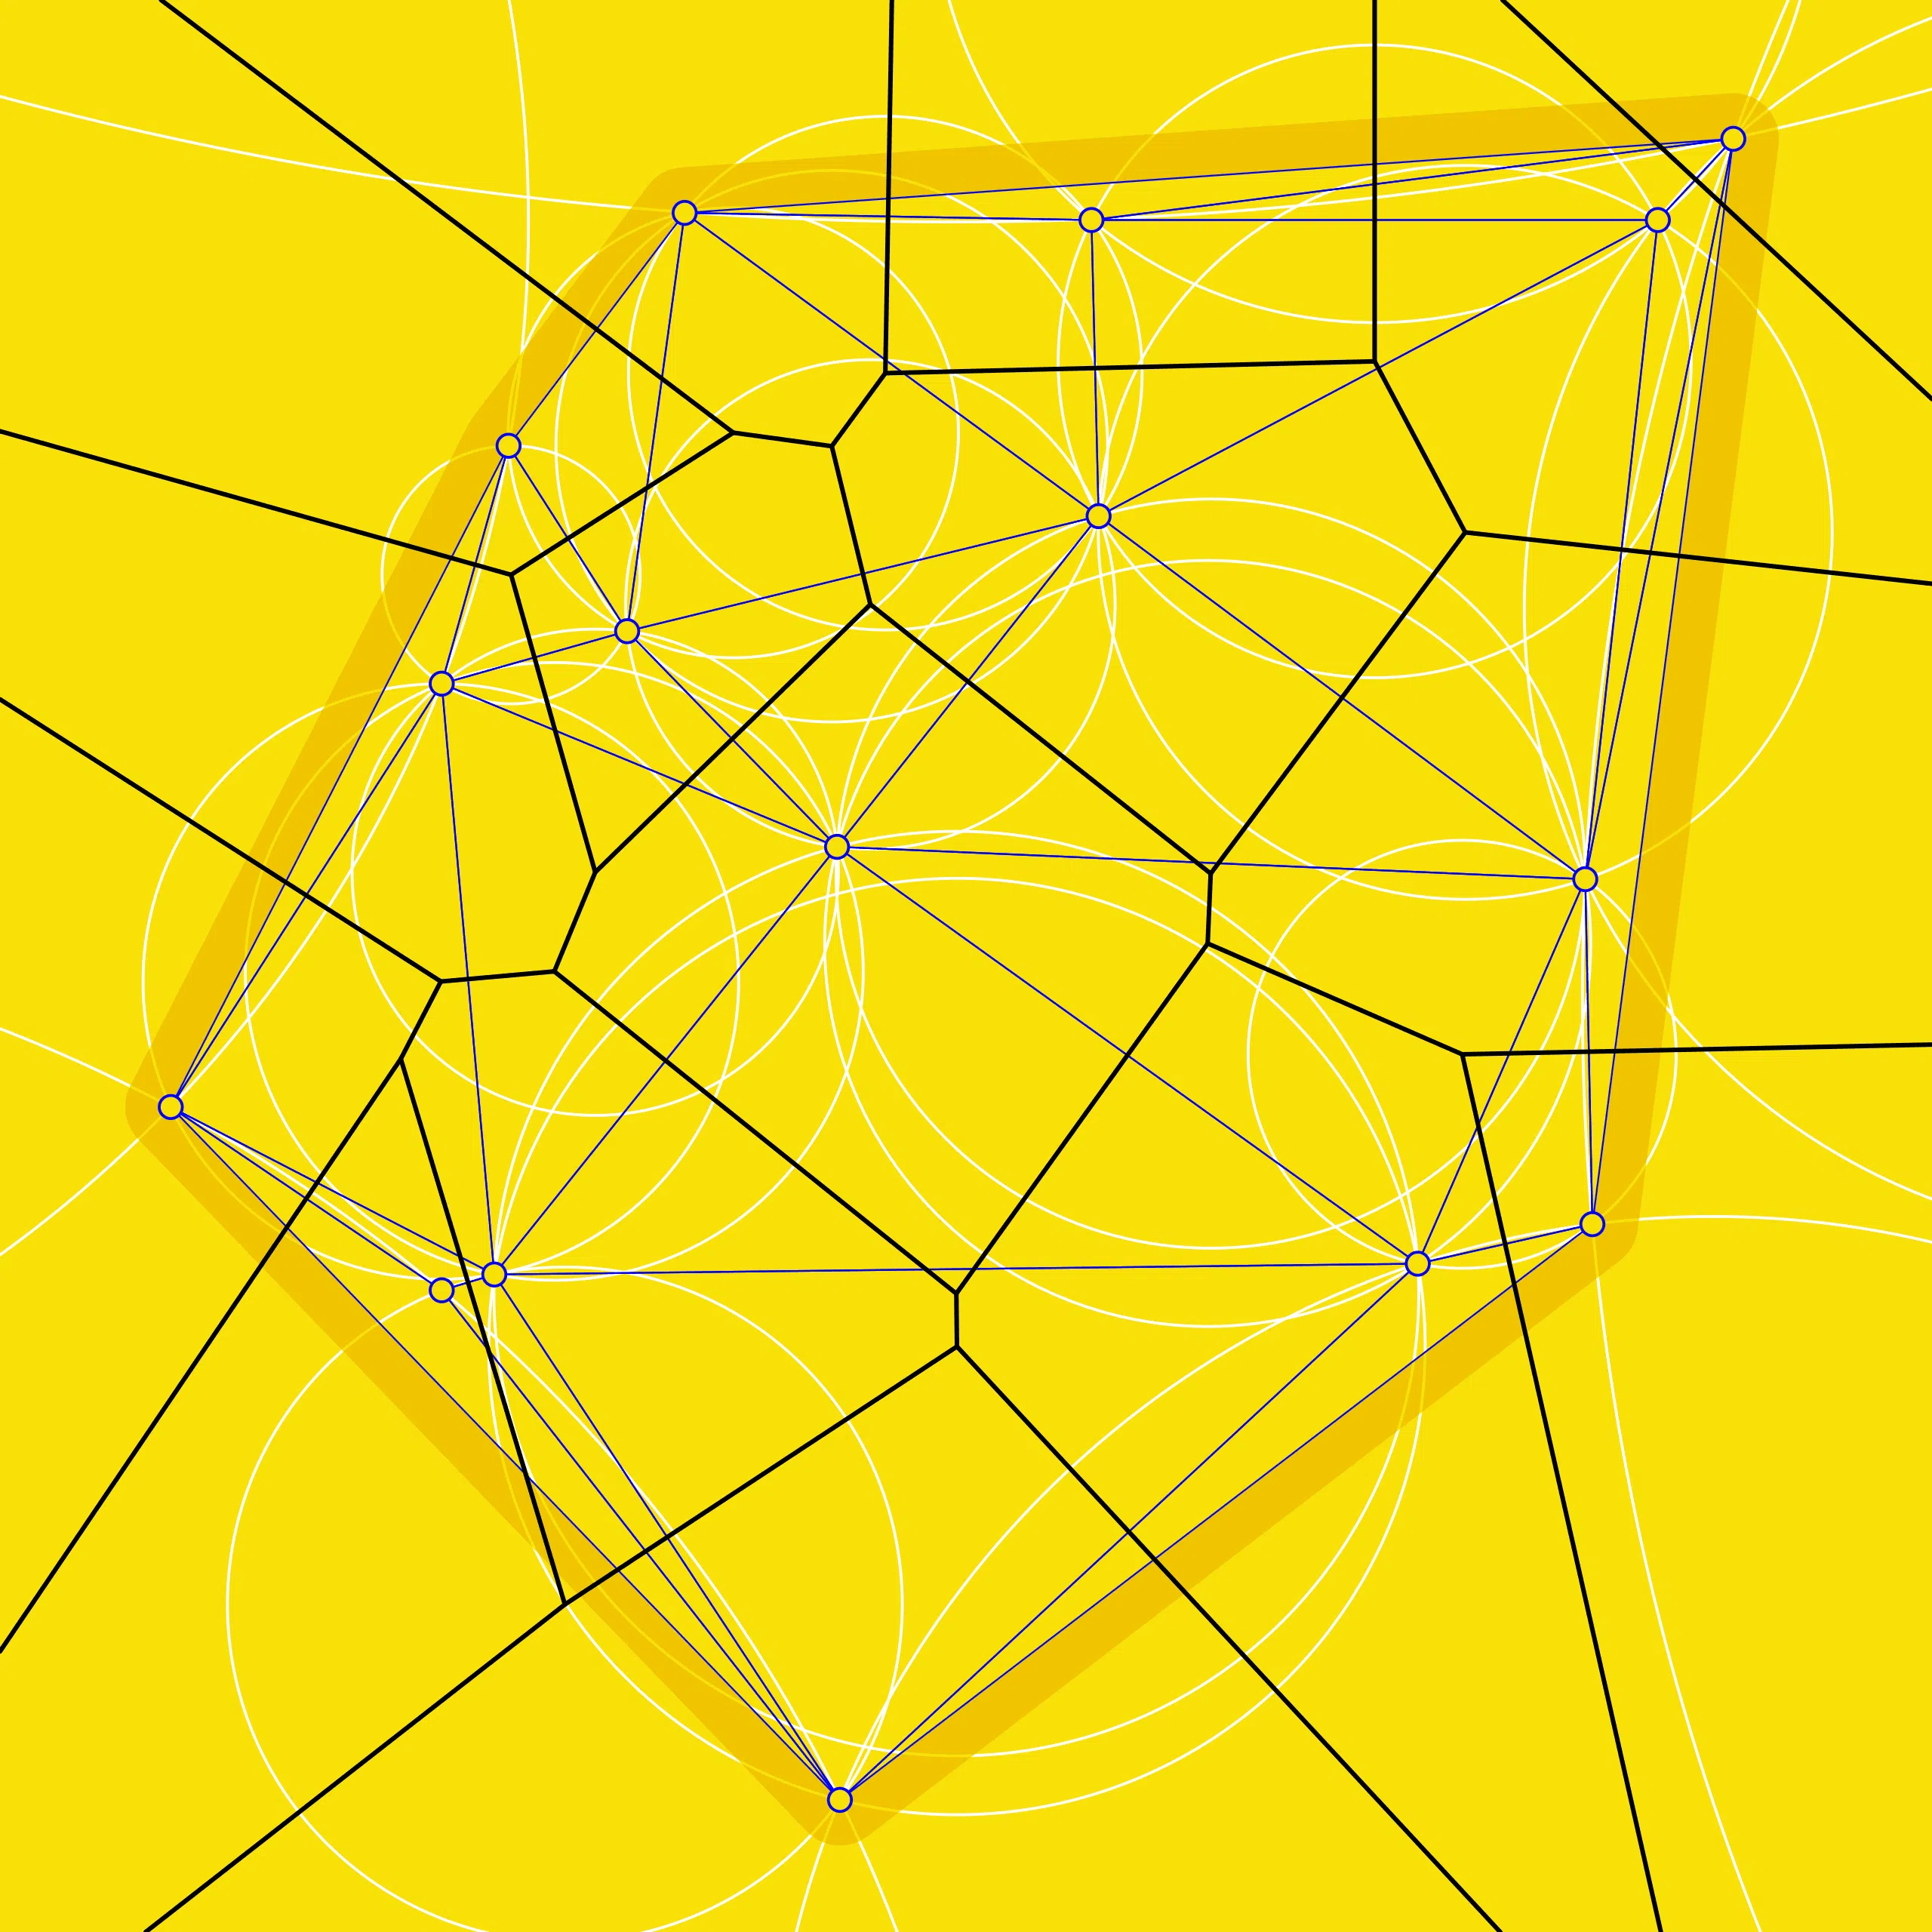
These two entangled geometries find themselves applied to numerous spatial modelling activities; 3D digital terrain models (TIN), proximity, territorial and density modelling, convex hull and more. The Voronoi diagram (also Thiessen polygons) is the dual graph of Delaunay triangulation.
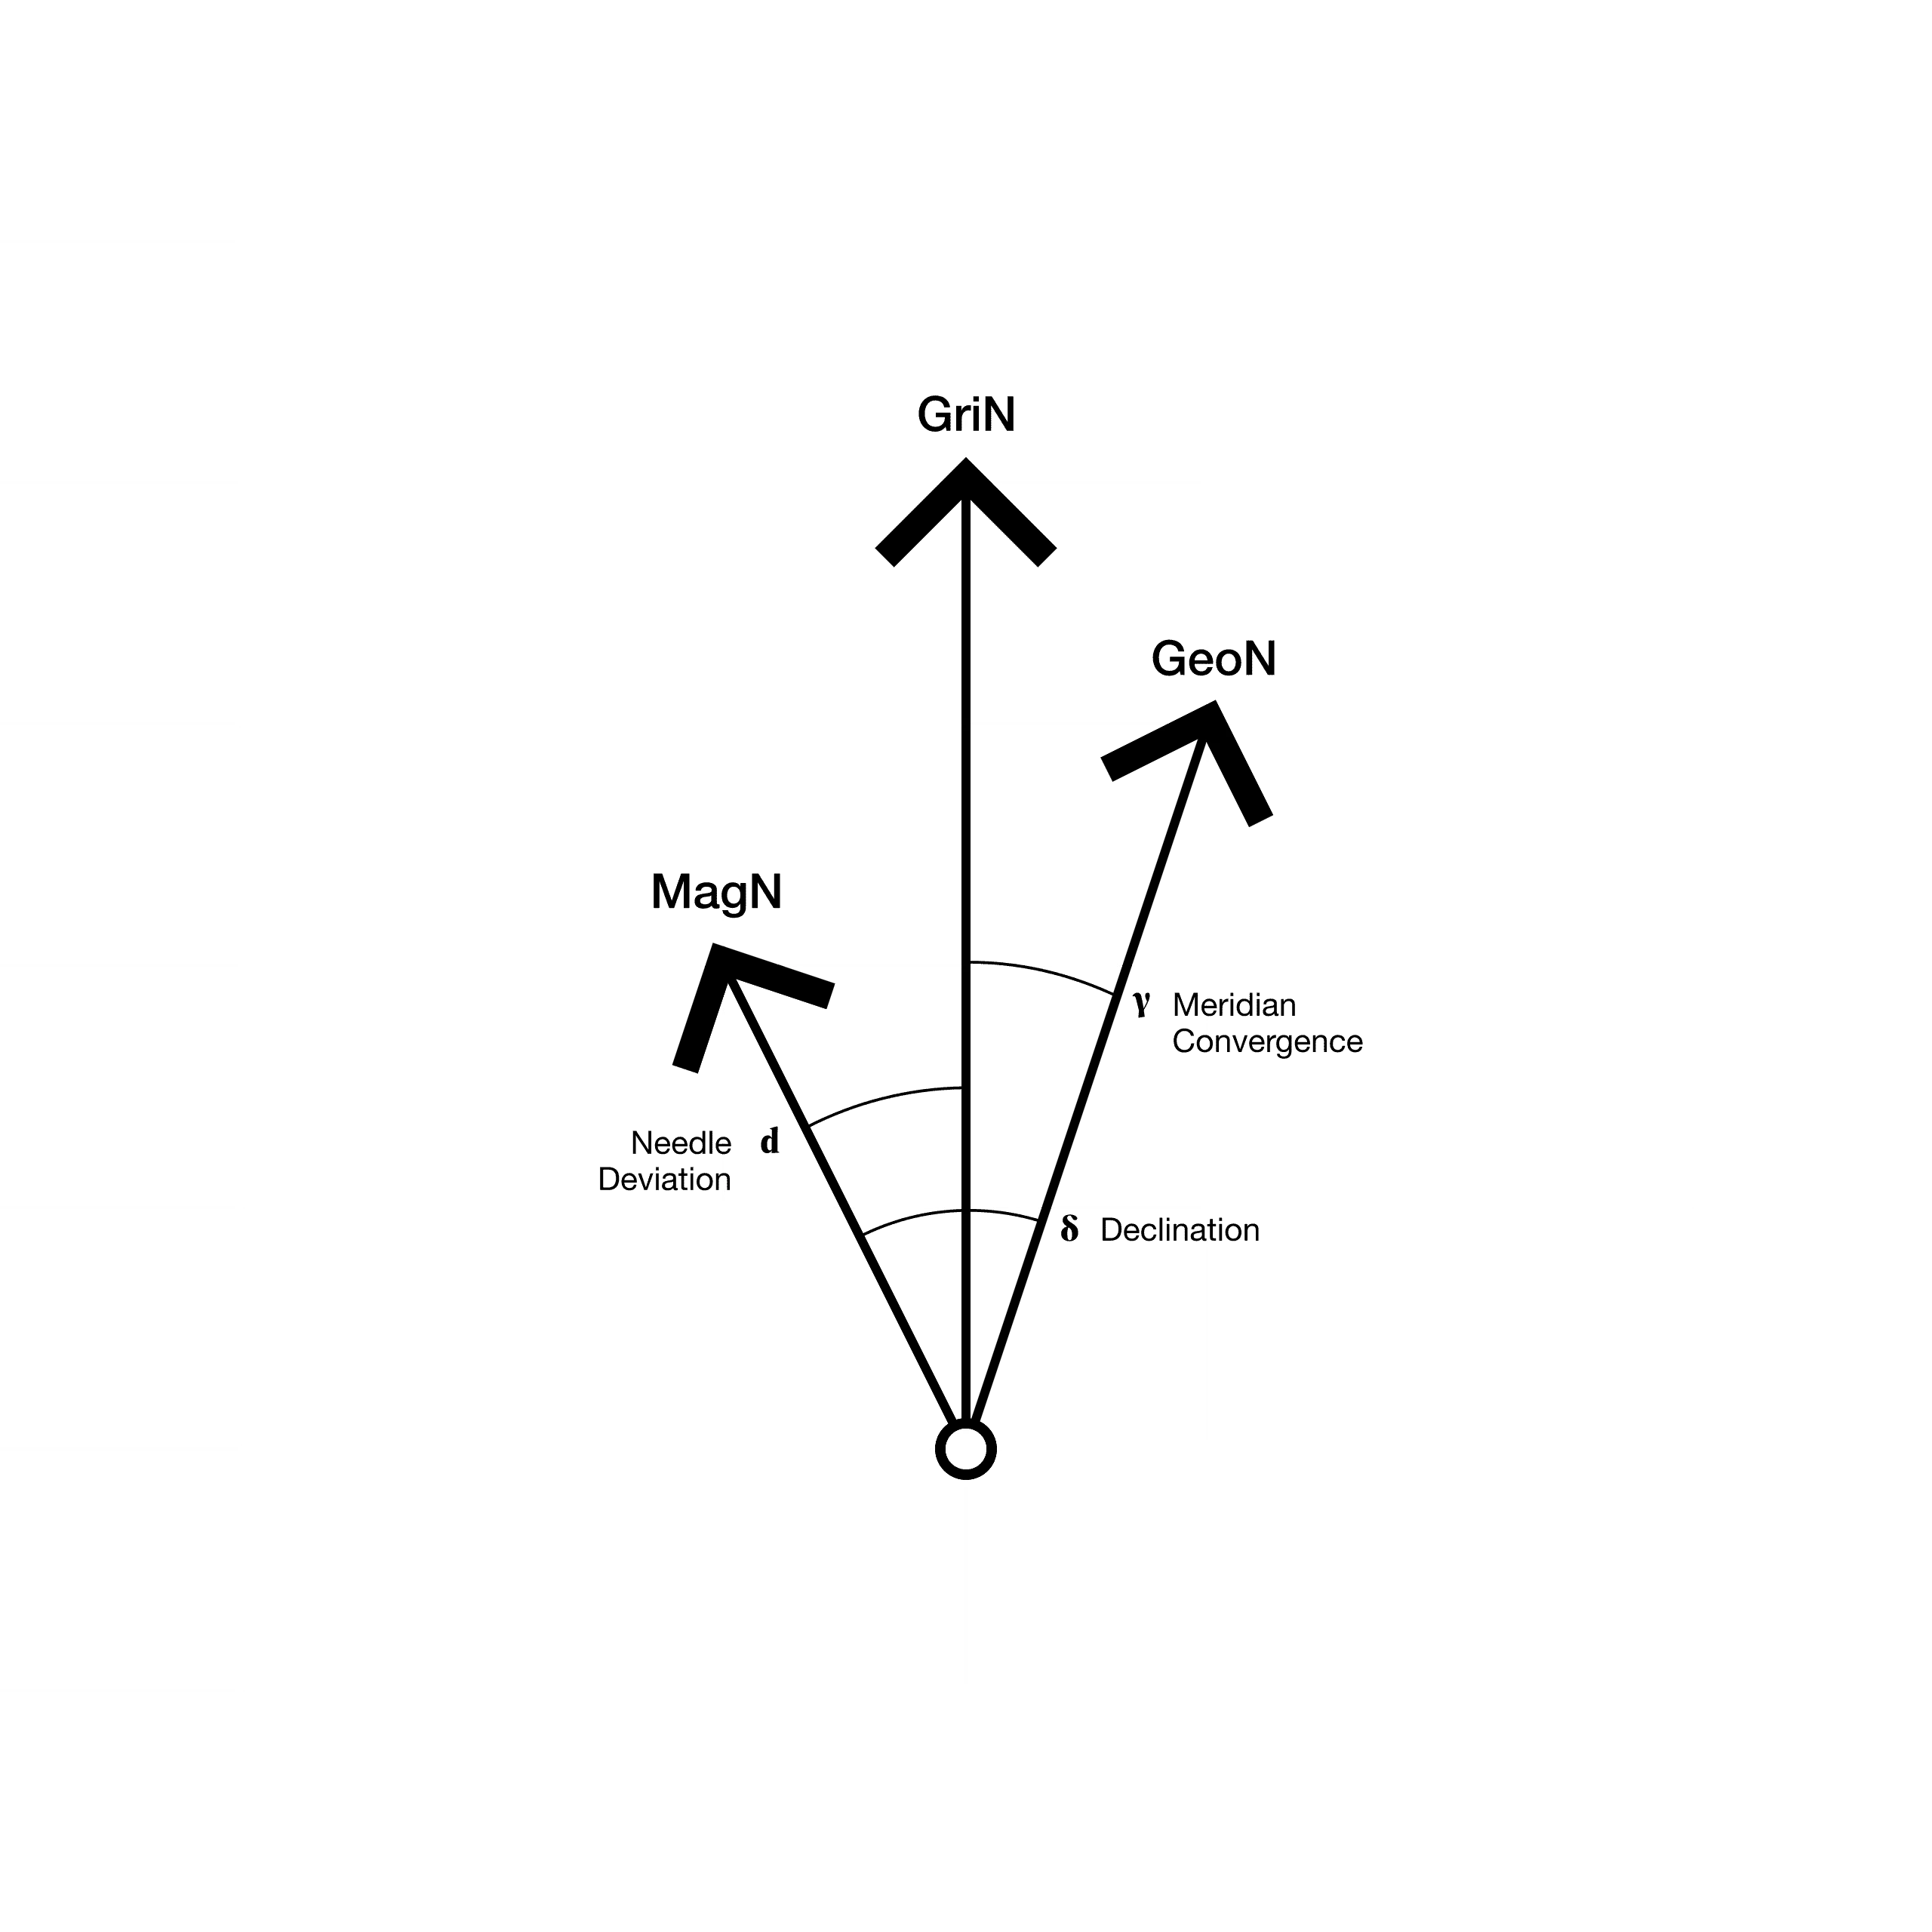
There are in fact three distinct north directions; magnetic (MagN), grid (GriN) and geographic (GeoN). Magnetic north moves over time, so constantly changes. Grid north is mathematically defined by the local coordinate system. Geographic north hits the intersection of the Earth’s axis of rotation.
Conventionally, maps have mostly had a cardinal alignment, with north at the top, whatever the medium. However, throughout history maps have also been aligned east, west and south, reflecting religious orthodoxy, geographical understanding or geopolitical agendas. When viewed from space, there is no up or down, so any directionality is valid.
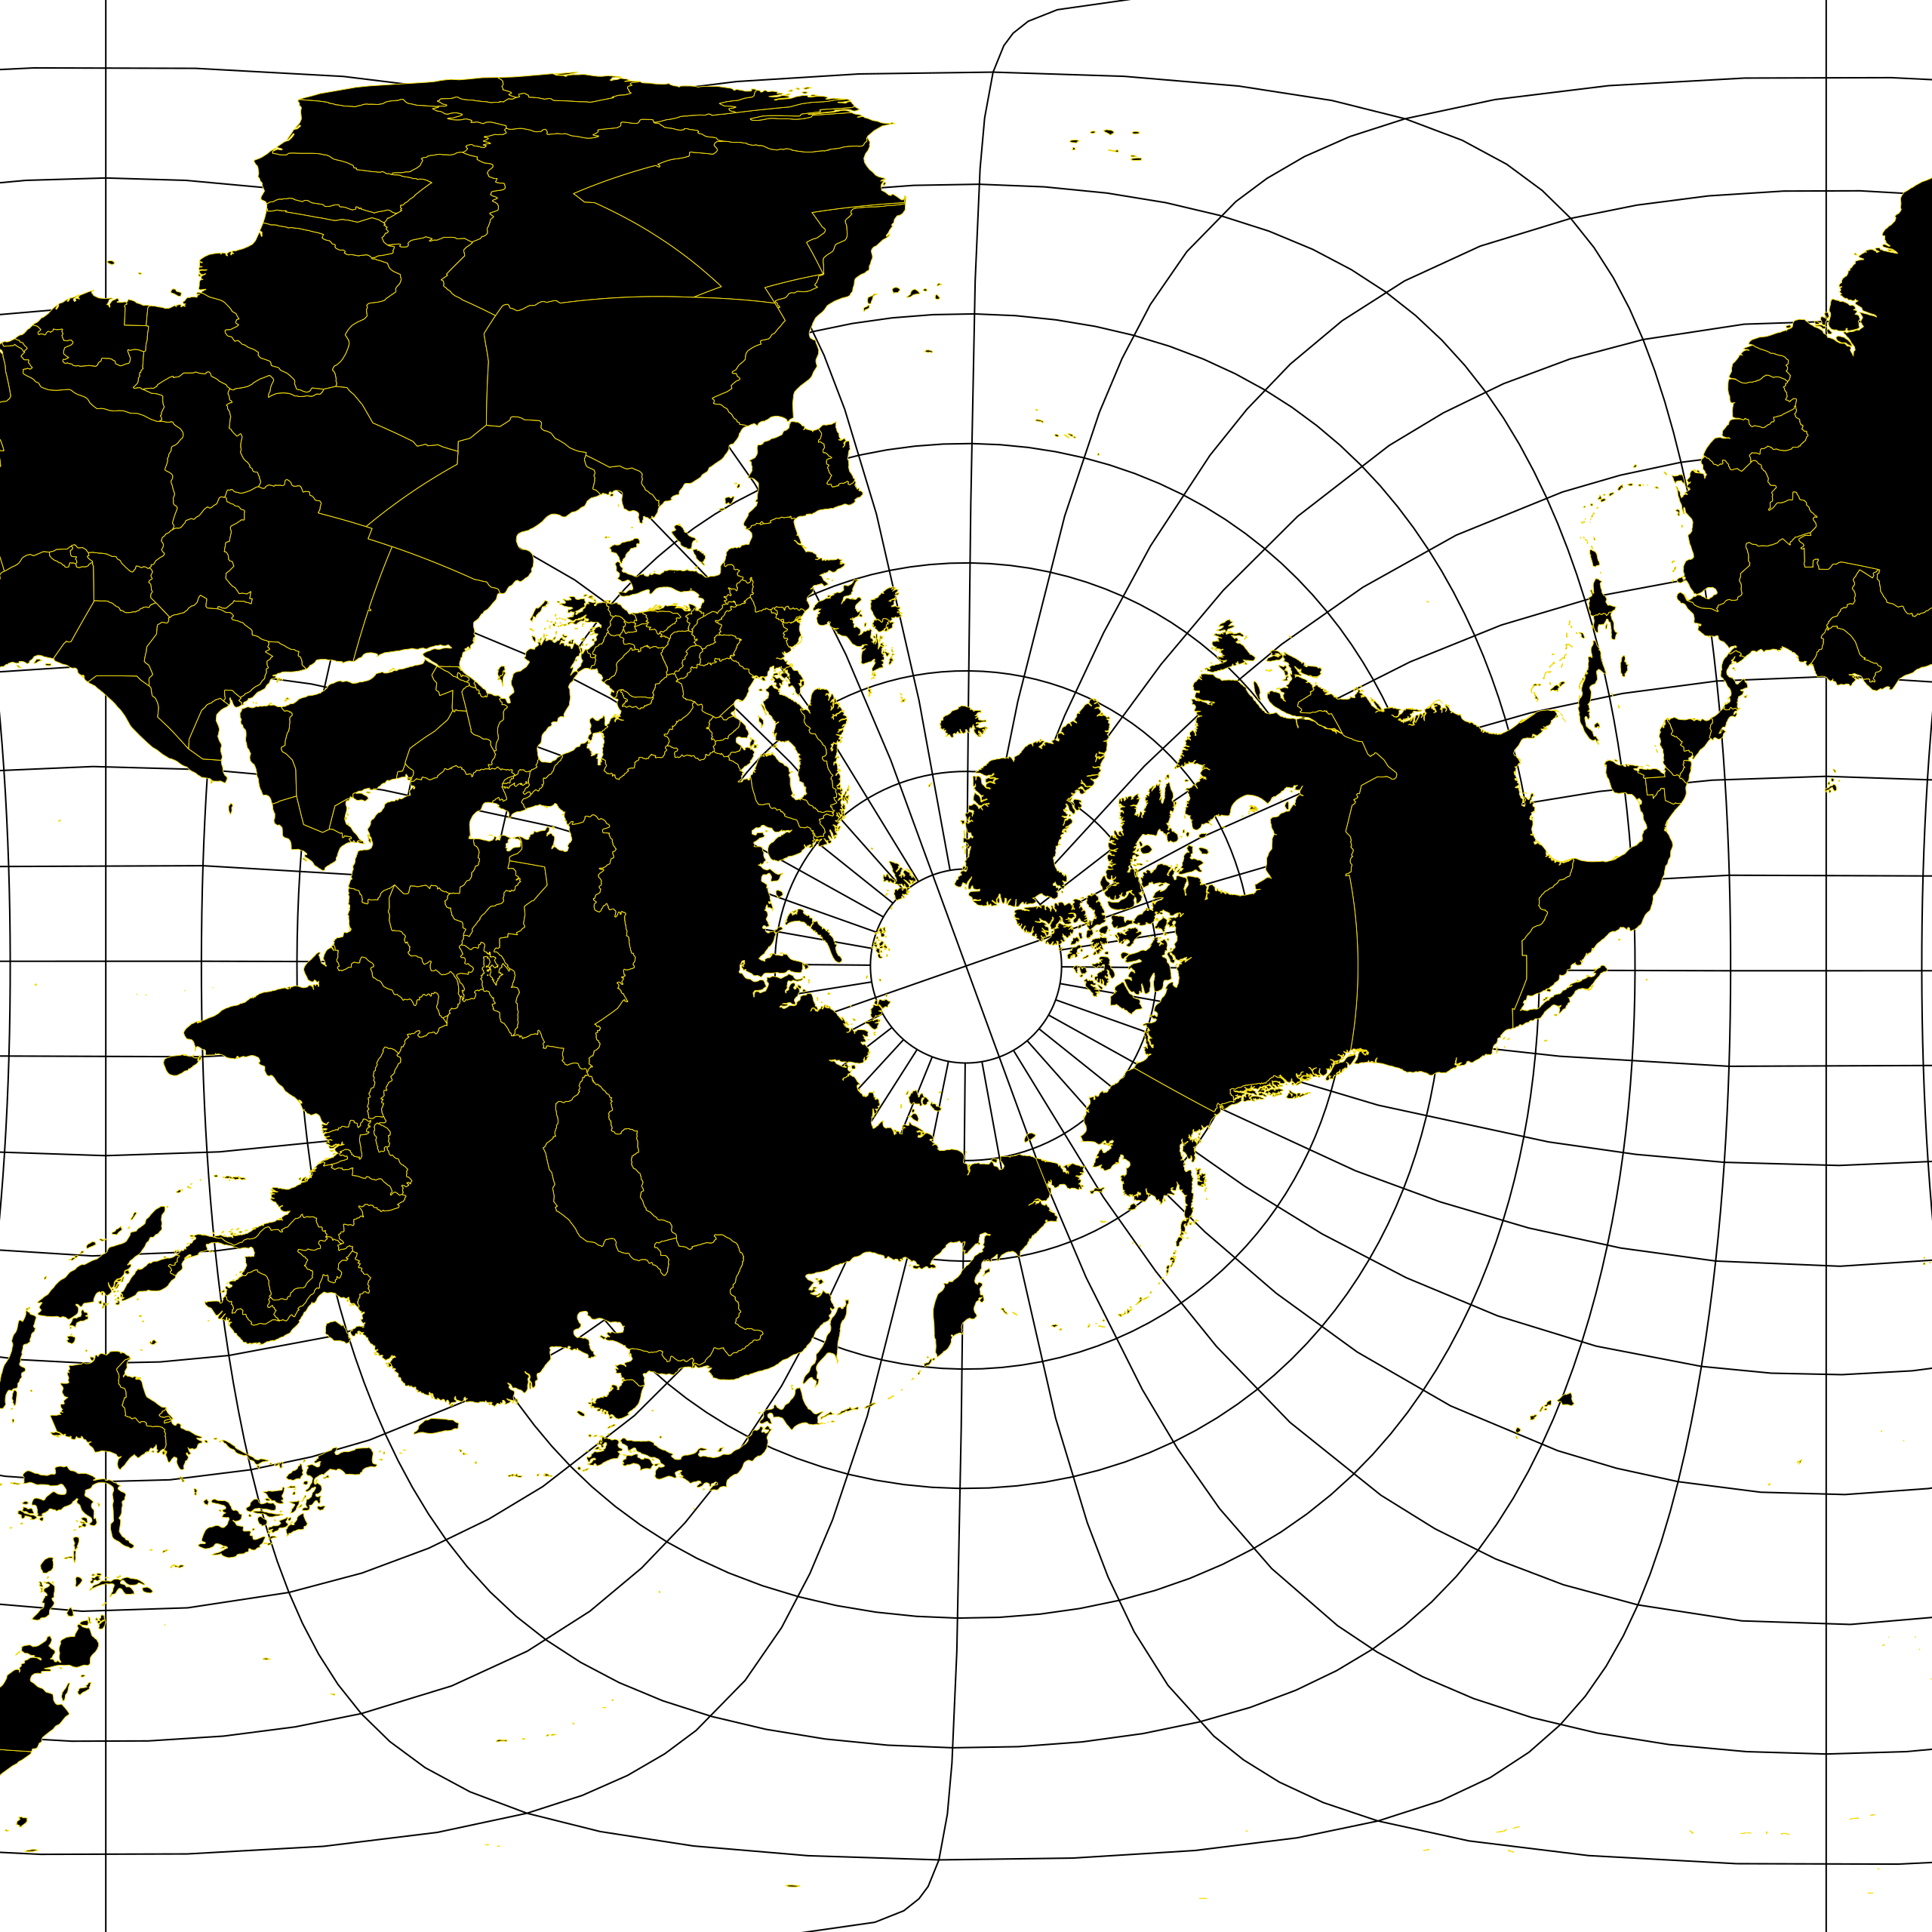
To continue with the ‘directionality’ theme, ‘heads-up’ is considered best practice in mapping for wayfinding. Simply, the map is aligned with your physical orientation and the real world; allowing easier and clearer orientation and navigation.
These maps are everywhere; weather map, geology map, statistical map, flow map, cartogram, etc. These types of map are not focused on the accurate location of features but rather the presentation and communication of a pattern or distribution of either tangible or intangible geographic phenomenon.
Naturally three-dimensional, isovists reveal the volume of space visible from a given point in that space, often presented either in the horizontal or vertical plane. It is a geometric concept coined by Clifford Tandy in 1967. Isovists assist with other concepts such as legibility, serial vision as applied to urban townscapes.